
Control What You See on a Tile
Restrict how much data a visual shows, regardless of the filters a reader selects on the report.
More often than not, you want to limit what a visual displays. For example, a tile might only show:
- For each customer, the order total in the current financial year
- Net sales in the last 3 months
The goal is to restrict the insight on a tile to the use case at hand. This page covers how to add those filters.
Adding Filters to Restrict Data
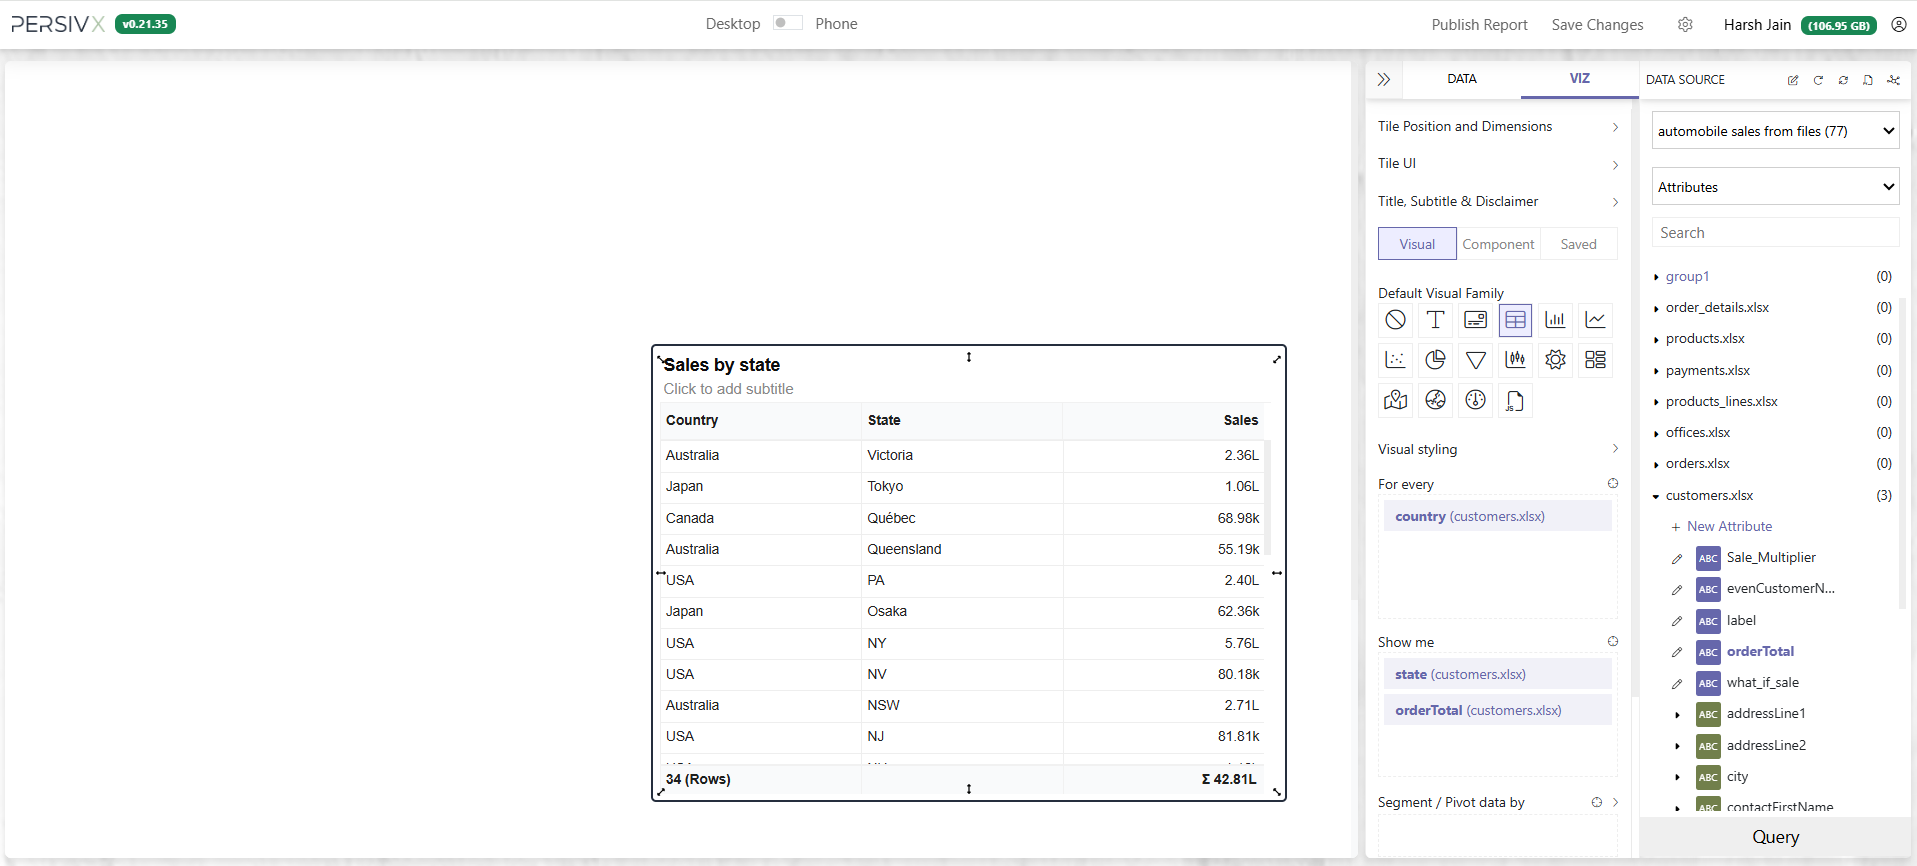
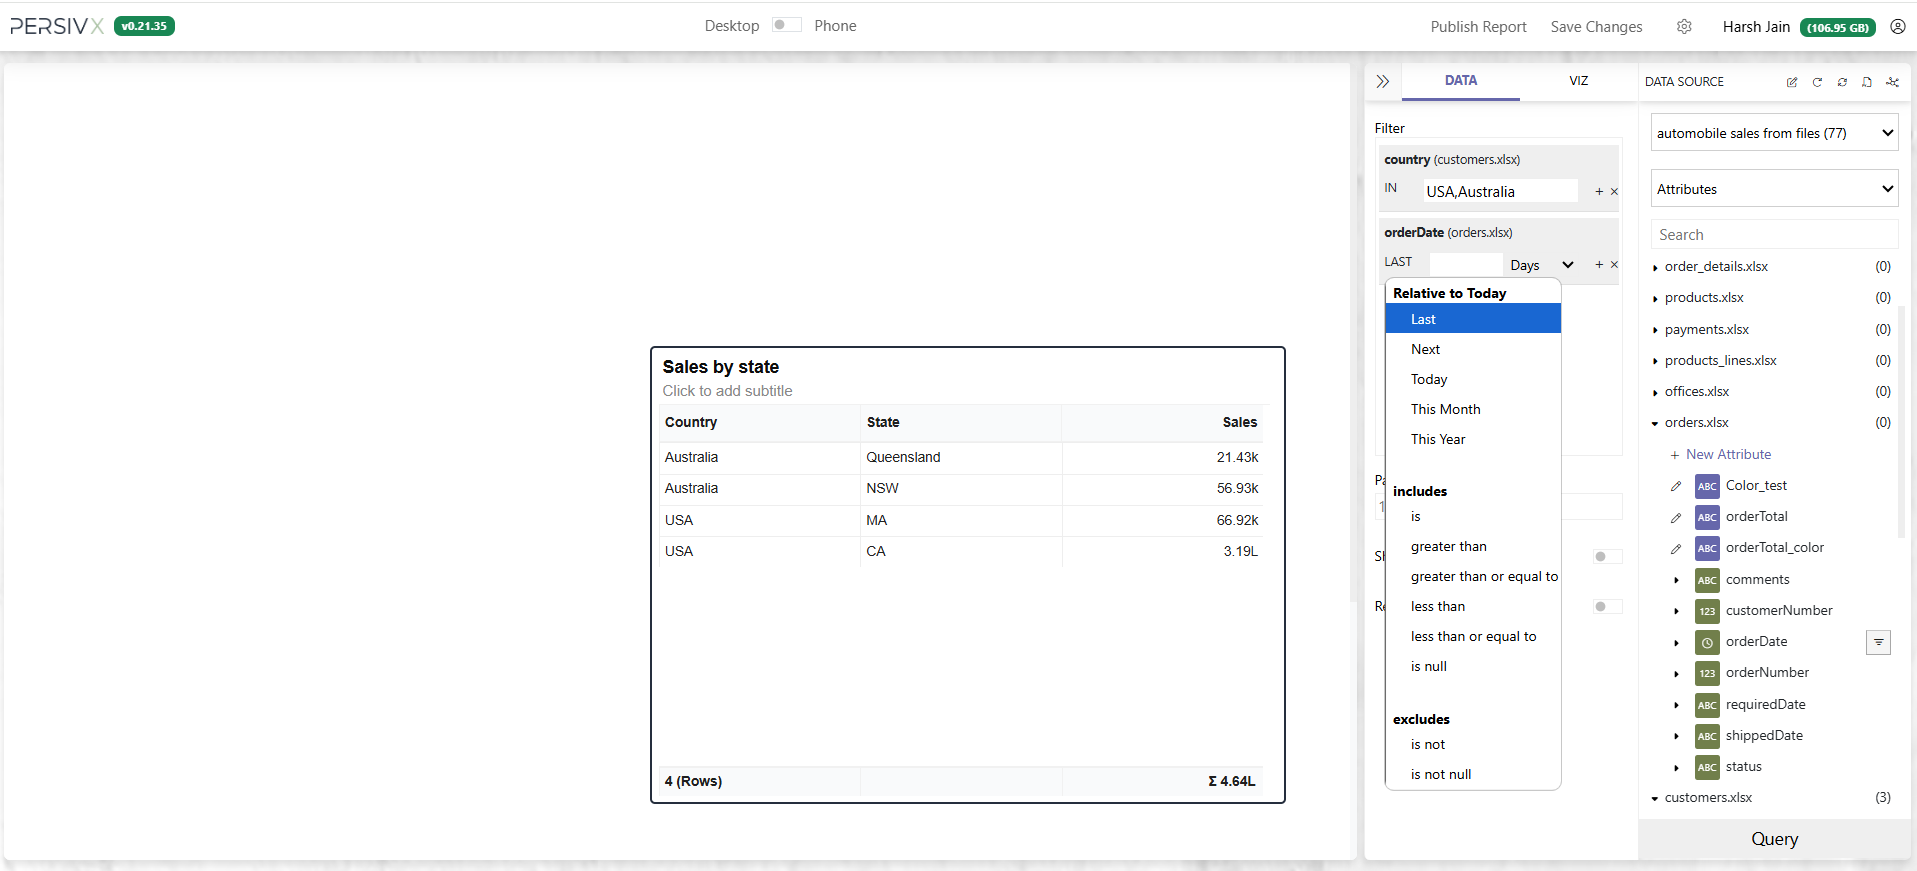
Say you have a visual showing sales by state, and you only want sales for the USA and Australia, since 1 January 2005.
Before: sales for all states of all countries.
Step 1: Open the Filter for an Attribute
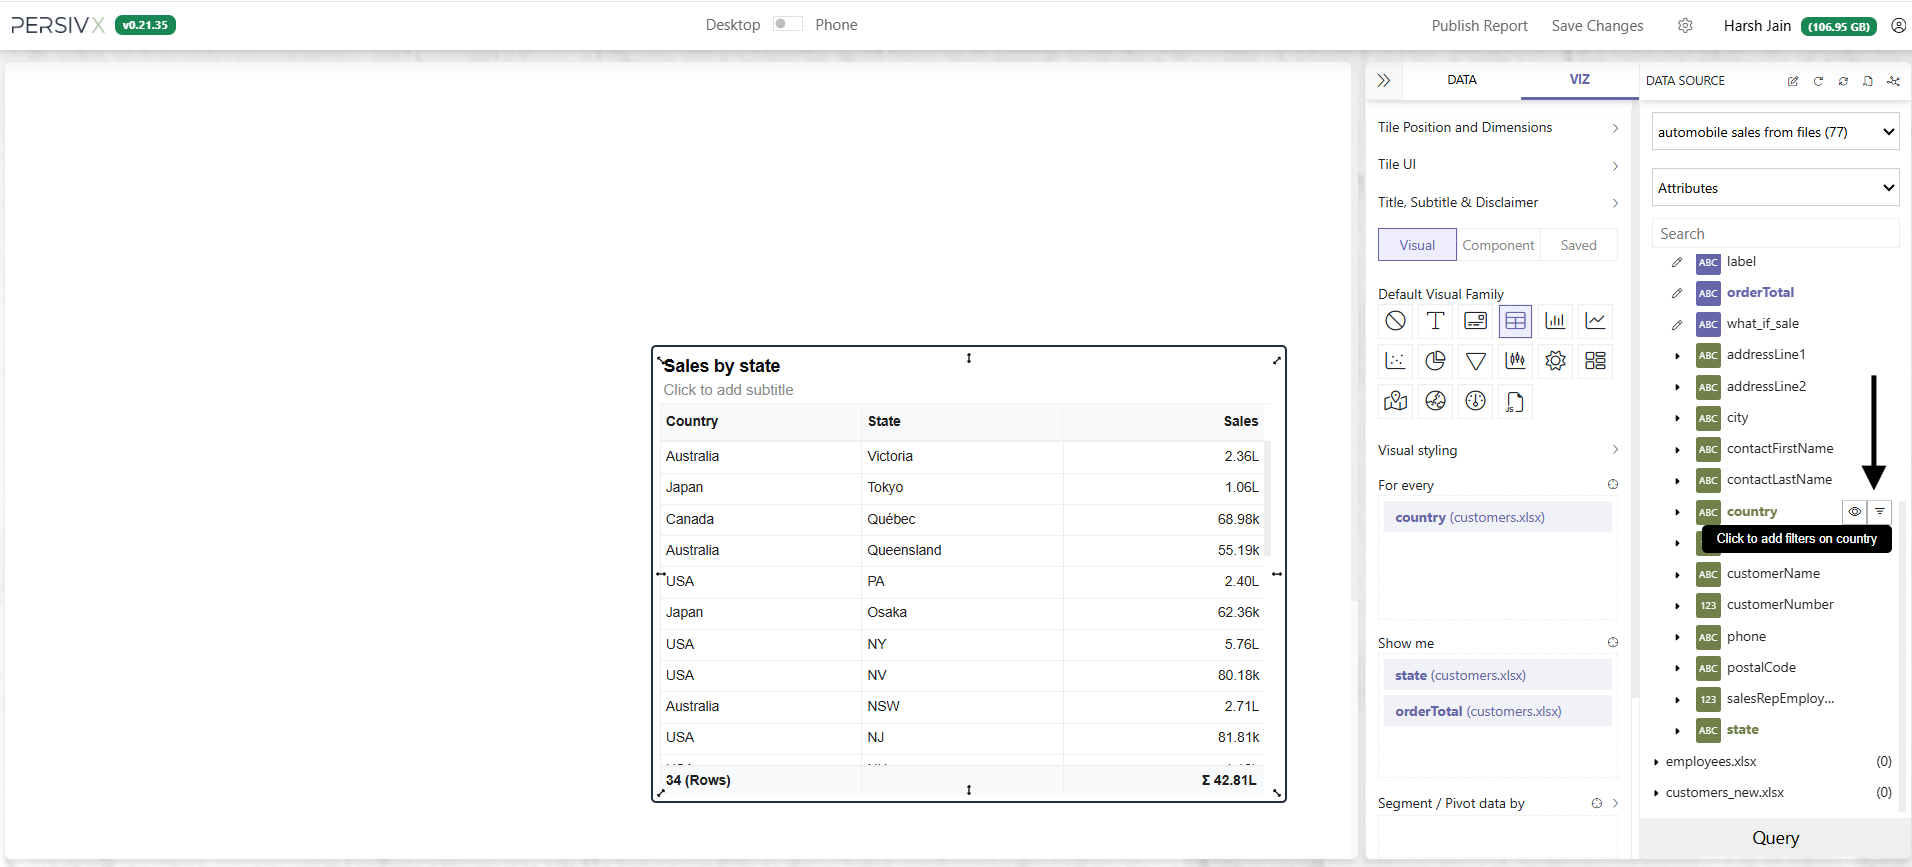
Find the country attribute in the attribute pane and click the filter icon next to it.
Step 2: Choose a Filter Type
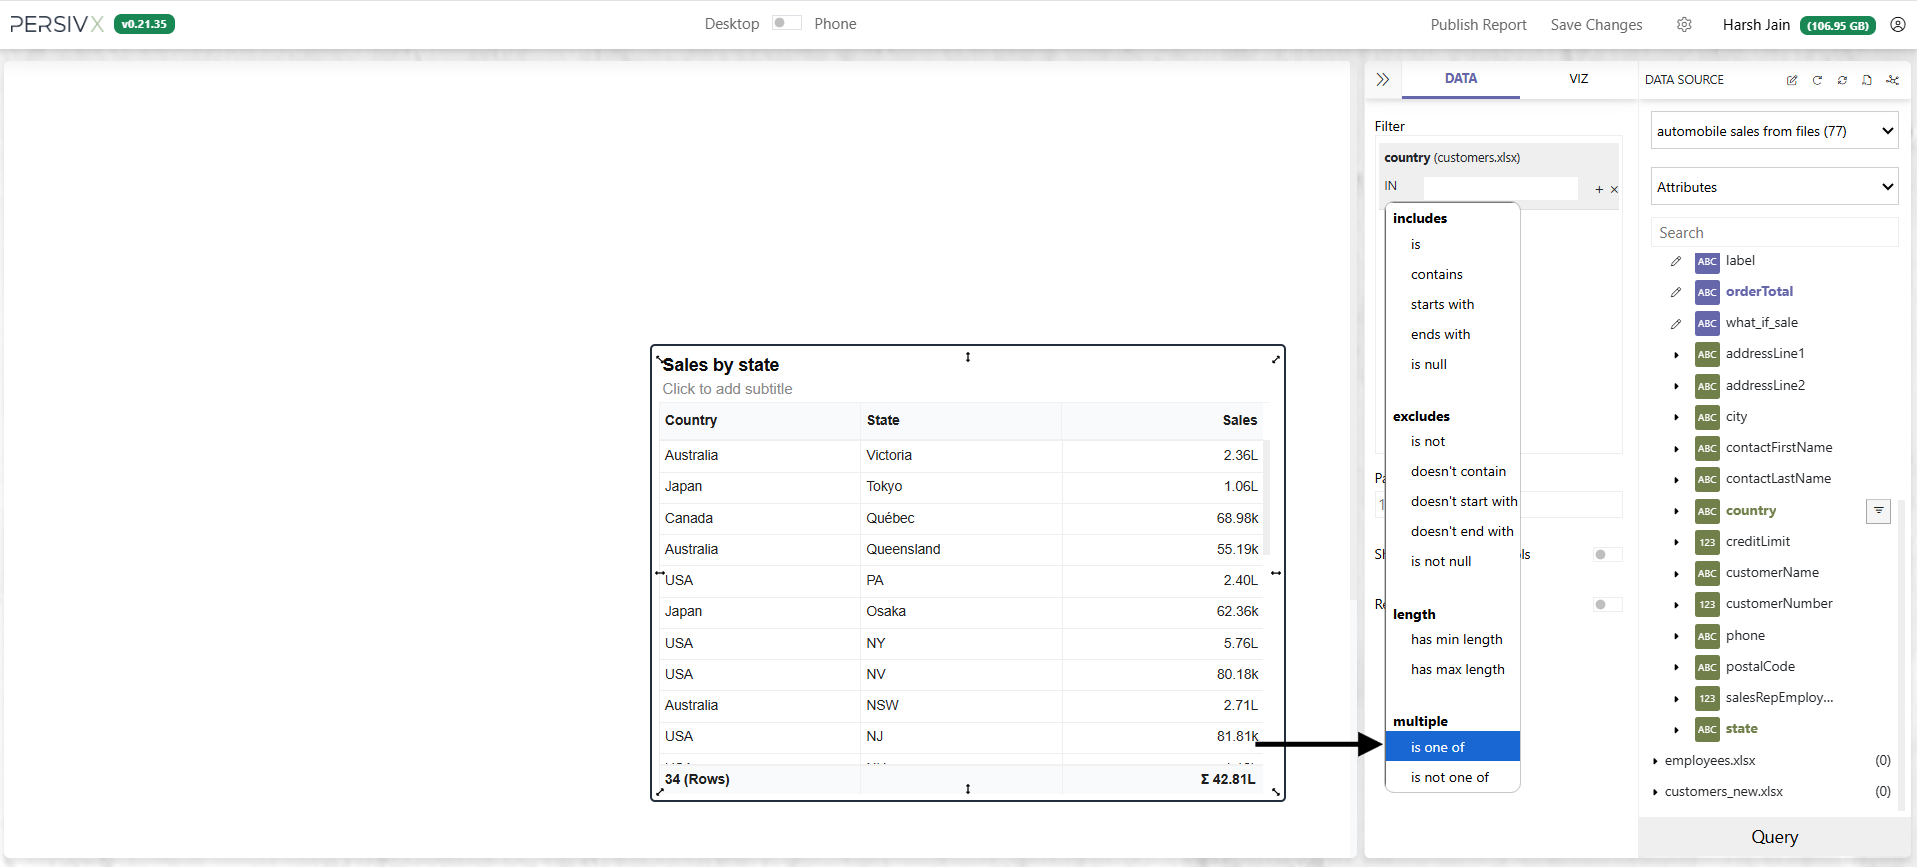
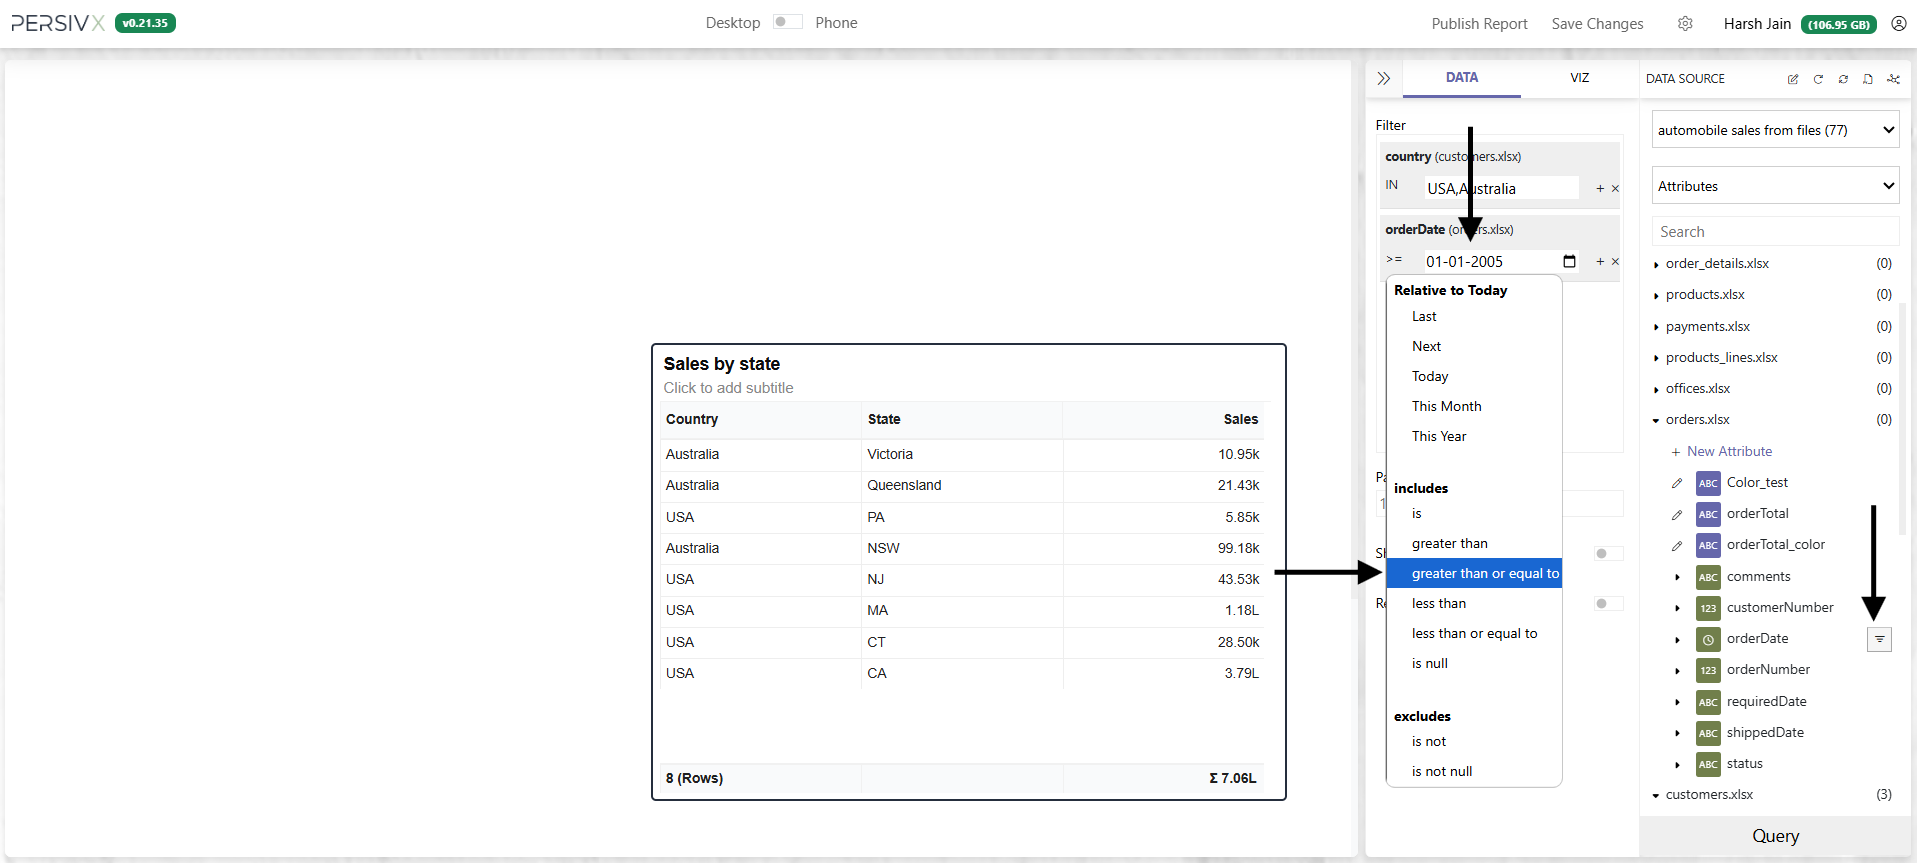
PersivX offers different filter types depending on the data in the column. Here we want is one of — the SQL IN clause, if you think in those terms.
Step 3: Provide the Filter Values
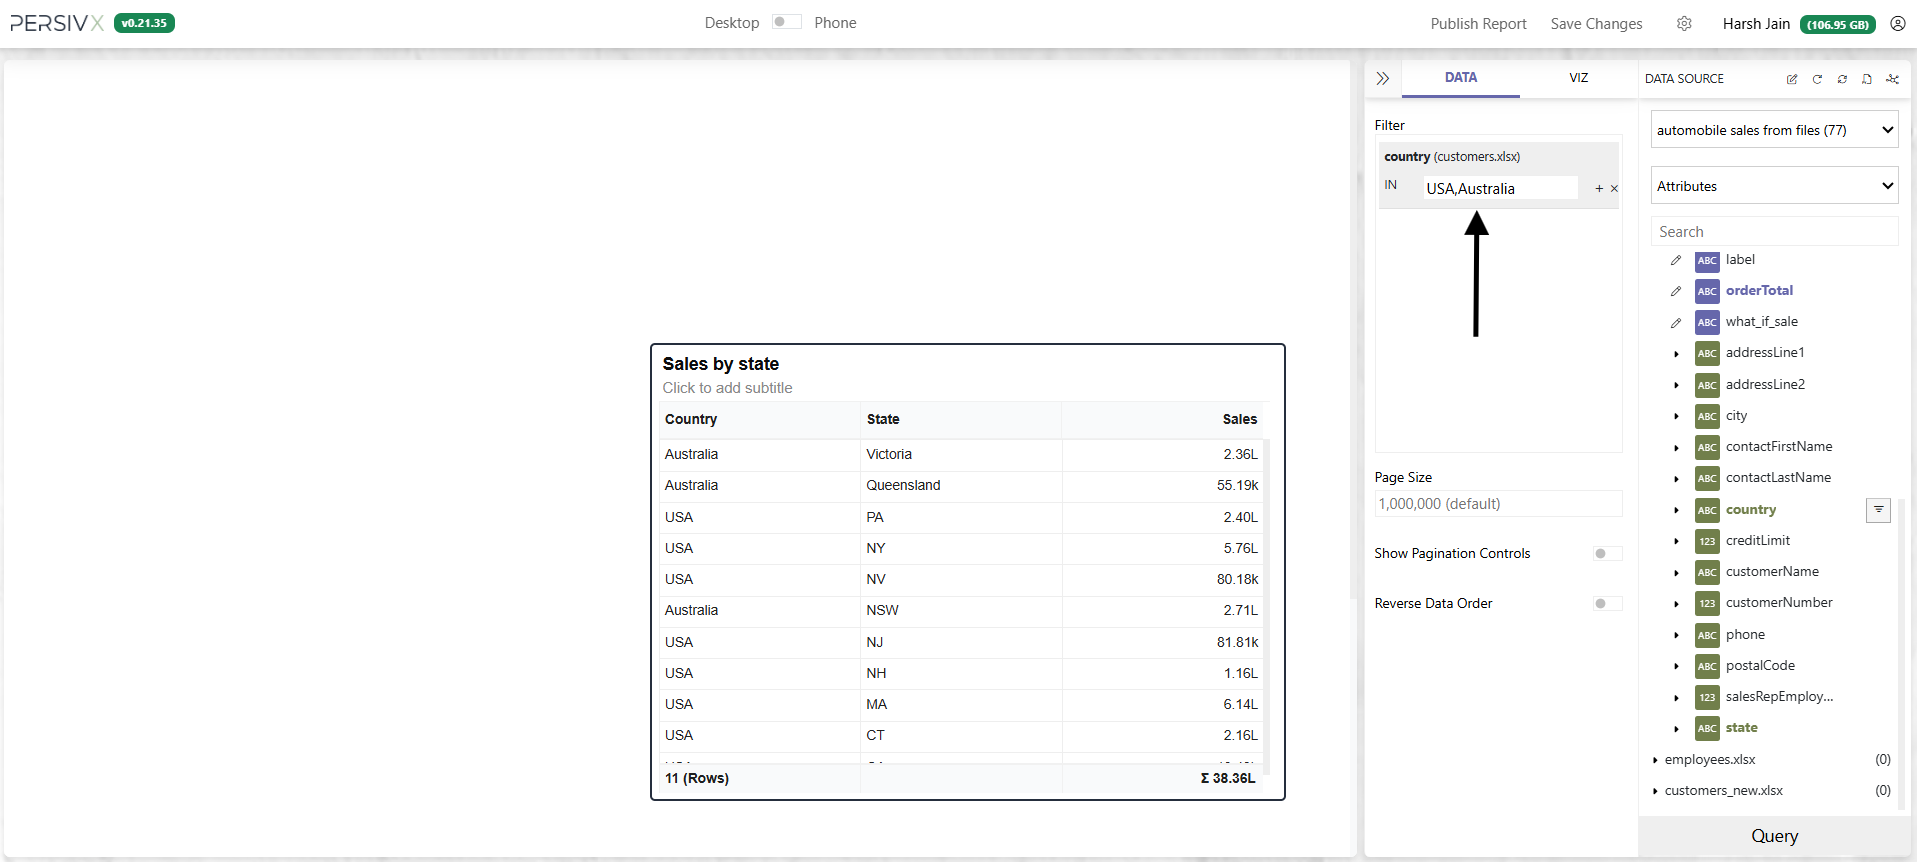
We only want data belonging to the USA and Australia, so the filter value is USA,Australia. Once added, don't forget to update the chart.
Step 4: Add a Date Filter
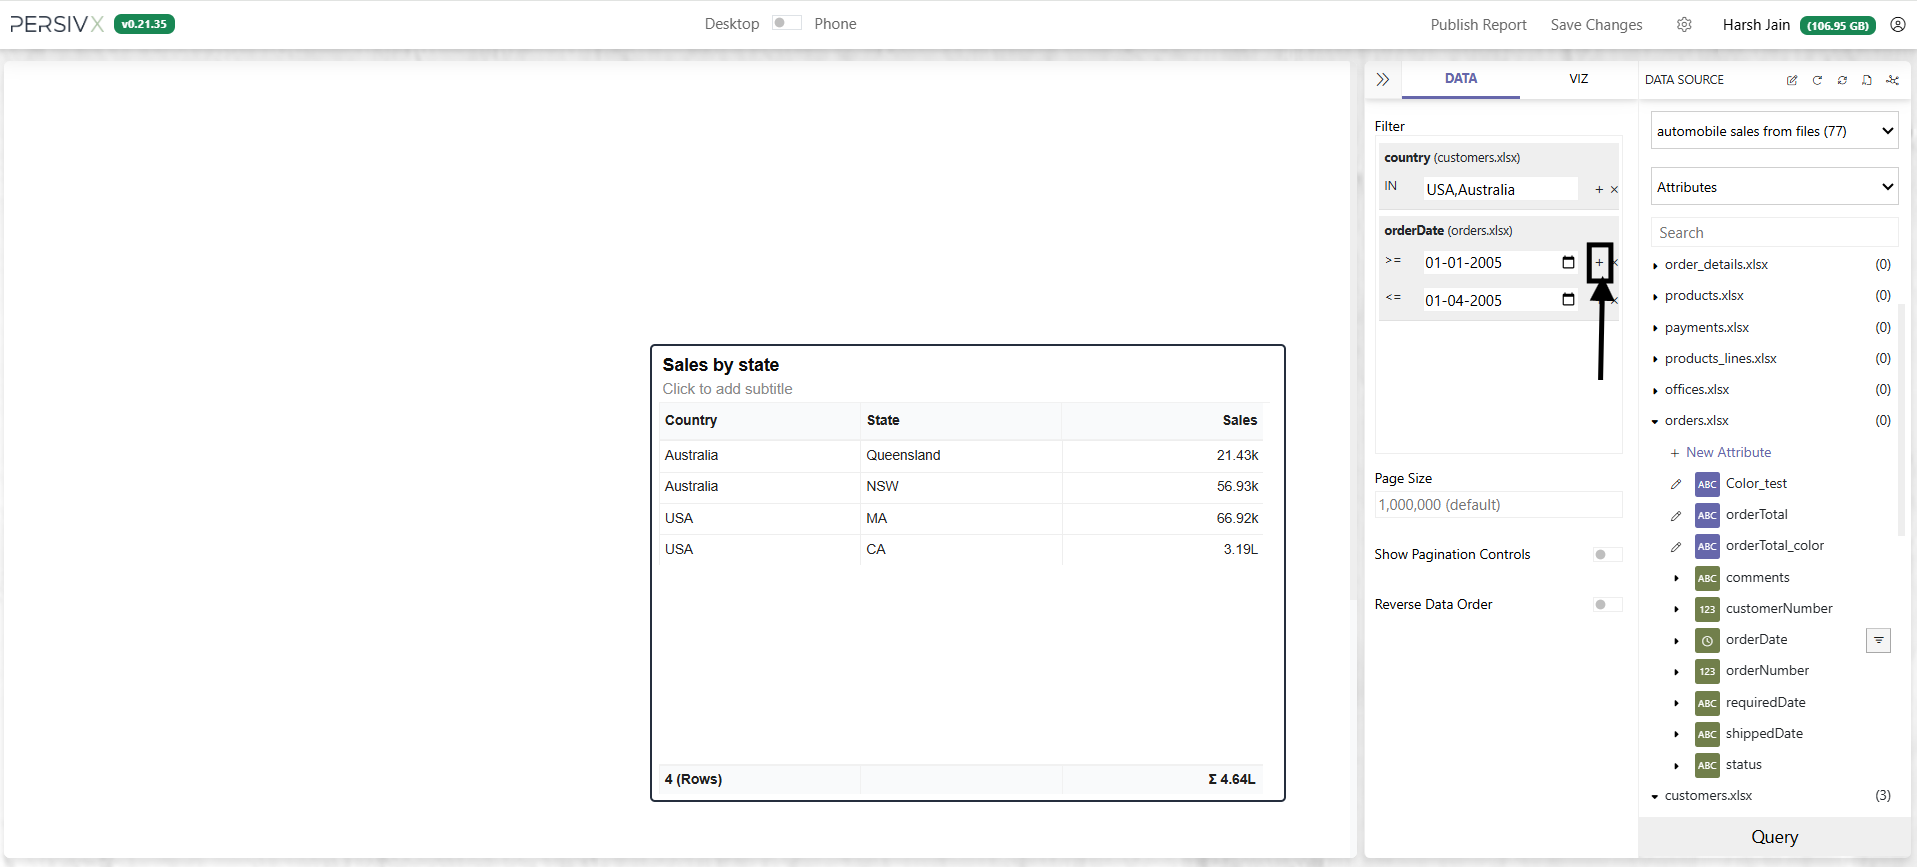
Repeat steps 2 and 3 on the orderDate field from the orders table. Choose the filter type greater than or equal to with the value 01-01-2005.
orderDate with the + icon.
Search Boxes on a Visual
Separate from the filters above, which a builder configures, two visual types carry a search box readers can use directly.
Filtering Bars on a Bar Chart
The magnifying-glass icon on a bar chart opens a Filter bars… box. Type into it and the chart narrows to the bars whose category label matches, which is the quickest way through a chart with more categories than fit comfortably on screen.
Searching a Table
Tables have the equivalent — a Search table… box that matches across every column at once — plus an optional per-column search row. See Working with Tables.
Fixing an Incorrect Column Type
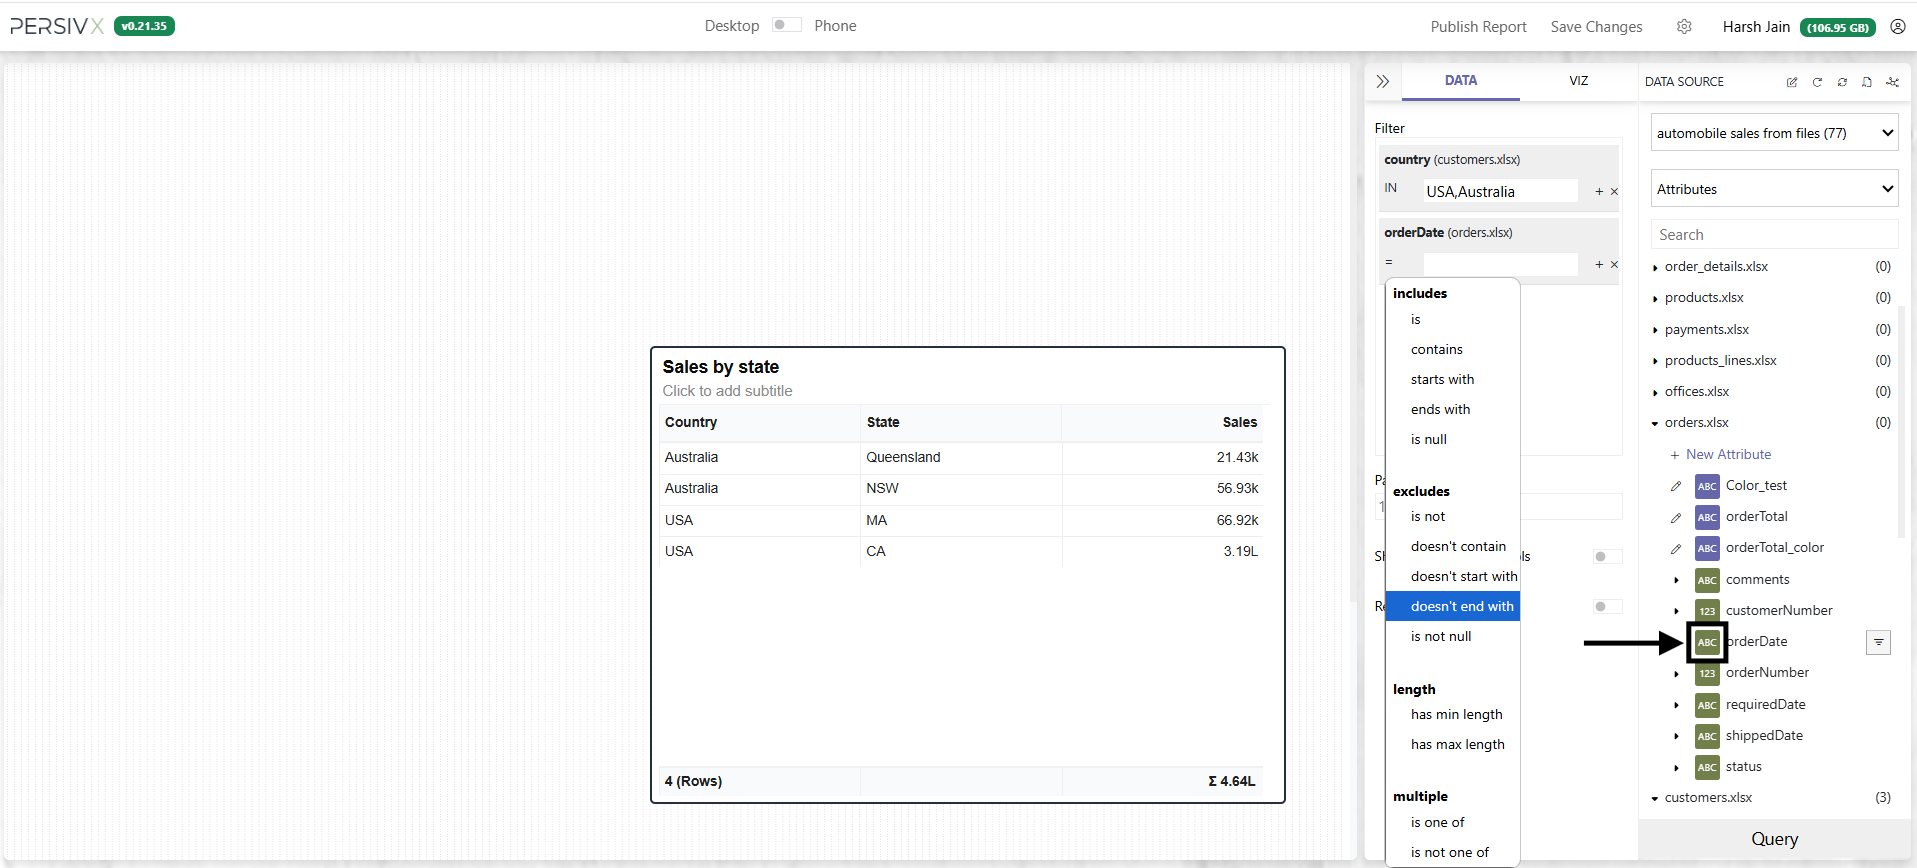
Not seeing the filter type you expected? Check that the auto-detected column type is correct. If it isn't, you can tell PersivX what type to assume.
Step 1: Click the Data Type
Click the data type shown next to the column name.
orderDate were alphanumeric rather than a date. This can happen because of how the database is set up, or how the values are stored in the column. Either way, it can be handled gracefully.
Step 2: Override the Column Type
Set the type to the one you expect and click Save.
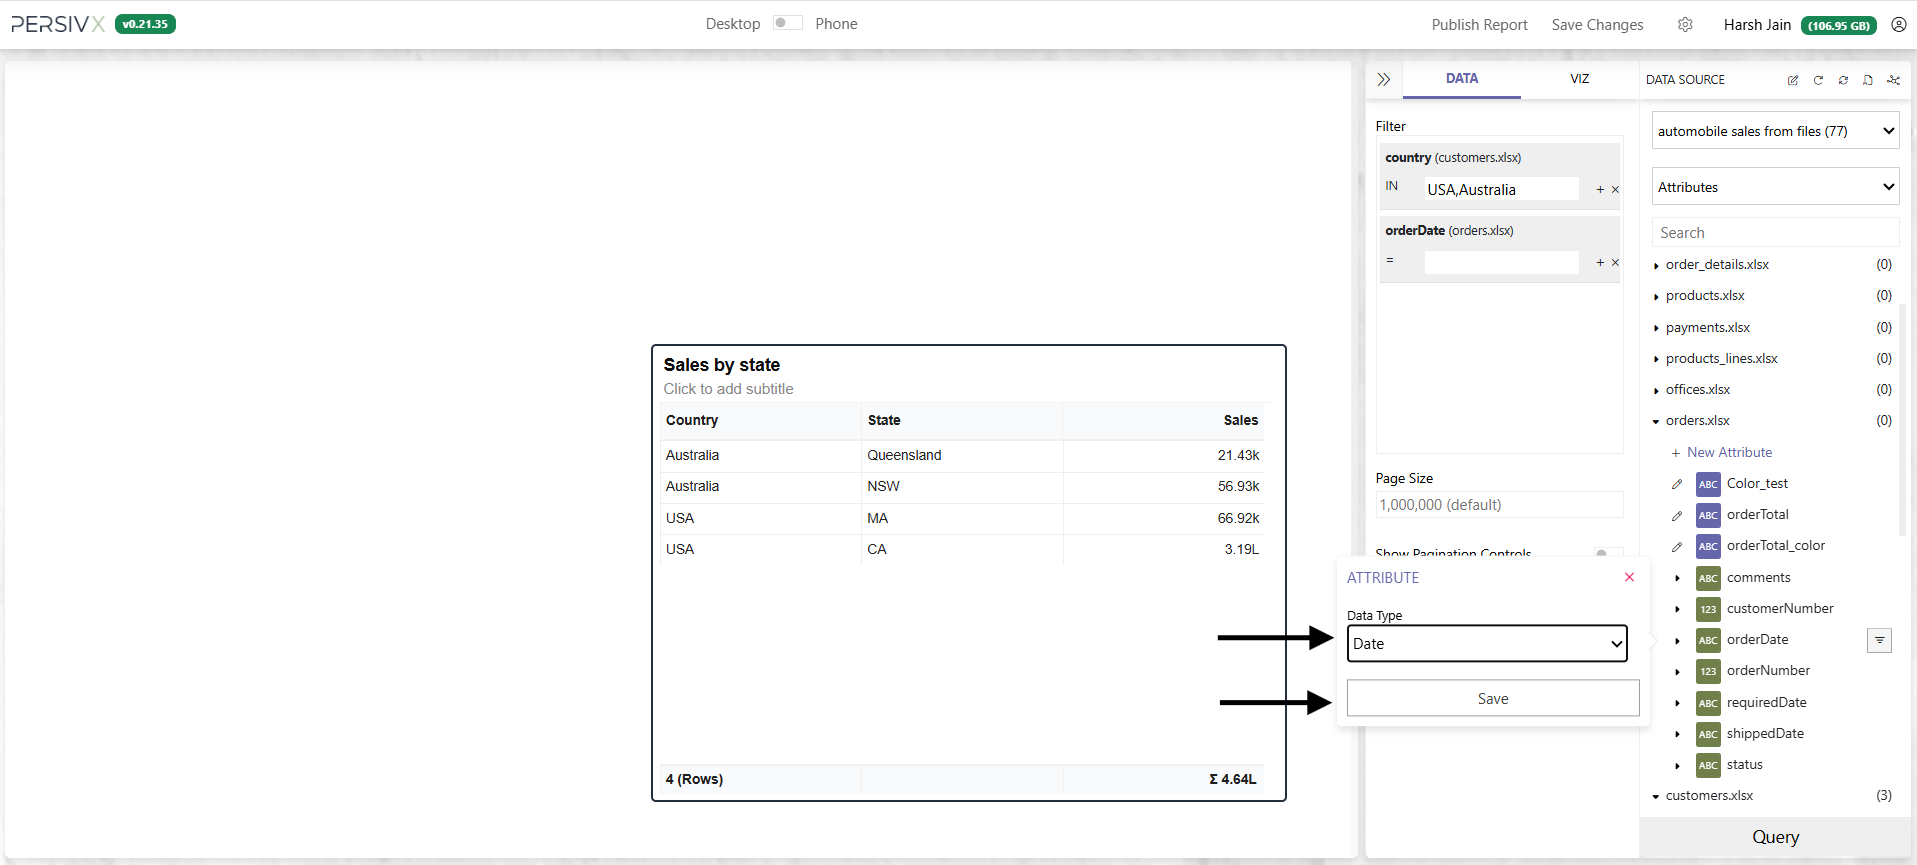
Step 3: Re-apply the Filter
Click the filter icon twice — once to remove the existing filter, and again to add it back based on the corrected column type.
orderDate contains a value like "PersivX" and you override the column to Date, the chart will fail to load — "PersivX" is not a date, but you have forced it to be treated as one.