
Custom Attribute (Select)
Define a calculation once at datasource level, then use it like any other column — across every tile and report.
PersivX lets you add new attributes — custom calculations — at the datasource level. They appear in the attributes list and behave exactly like columns that came from the datasource itself. Custom attributes are coloured blue so they're easy to tell apart from real datasource columns, which are green.
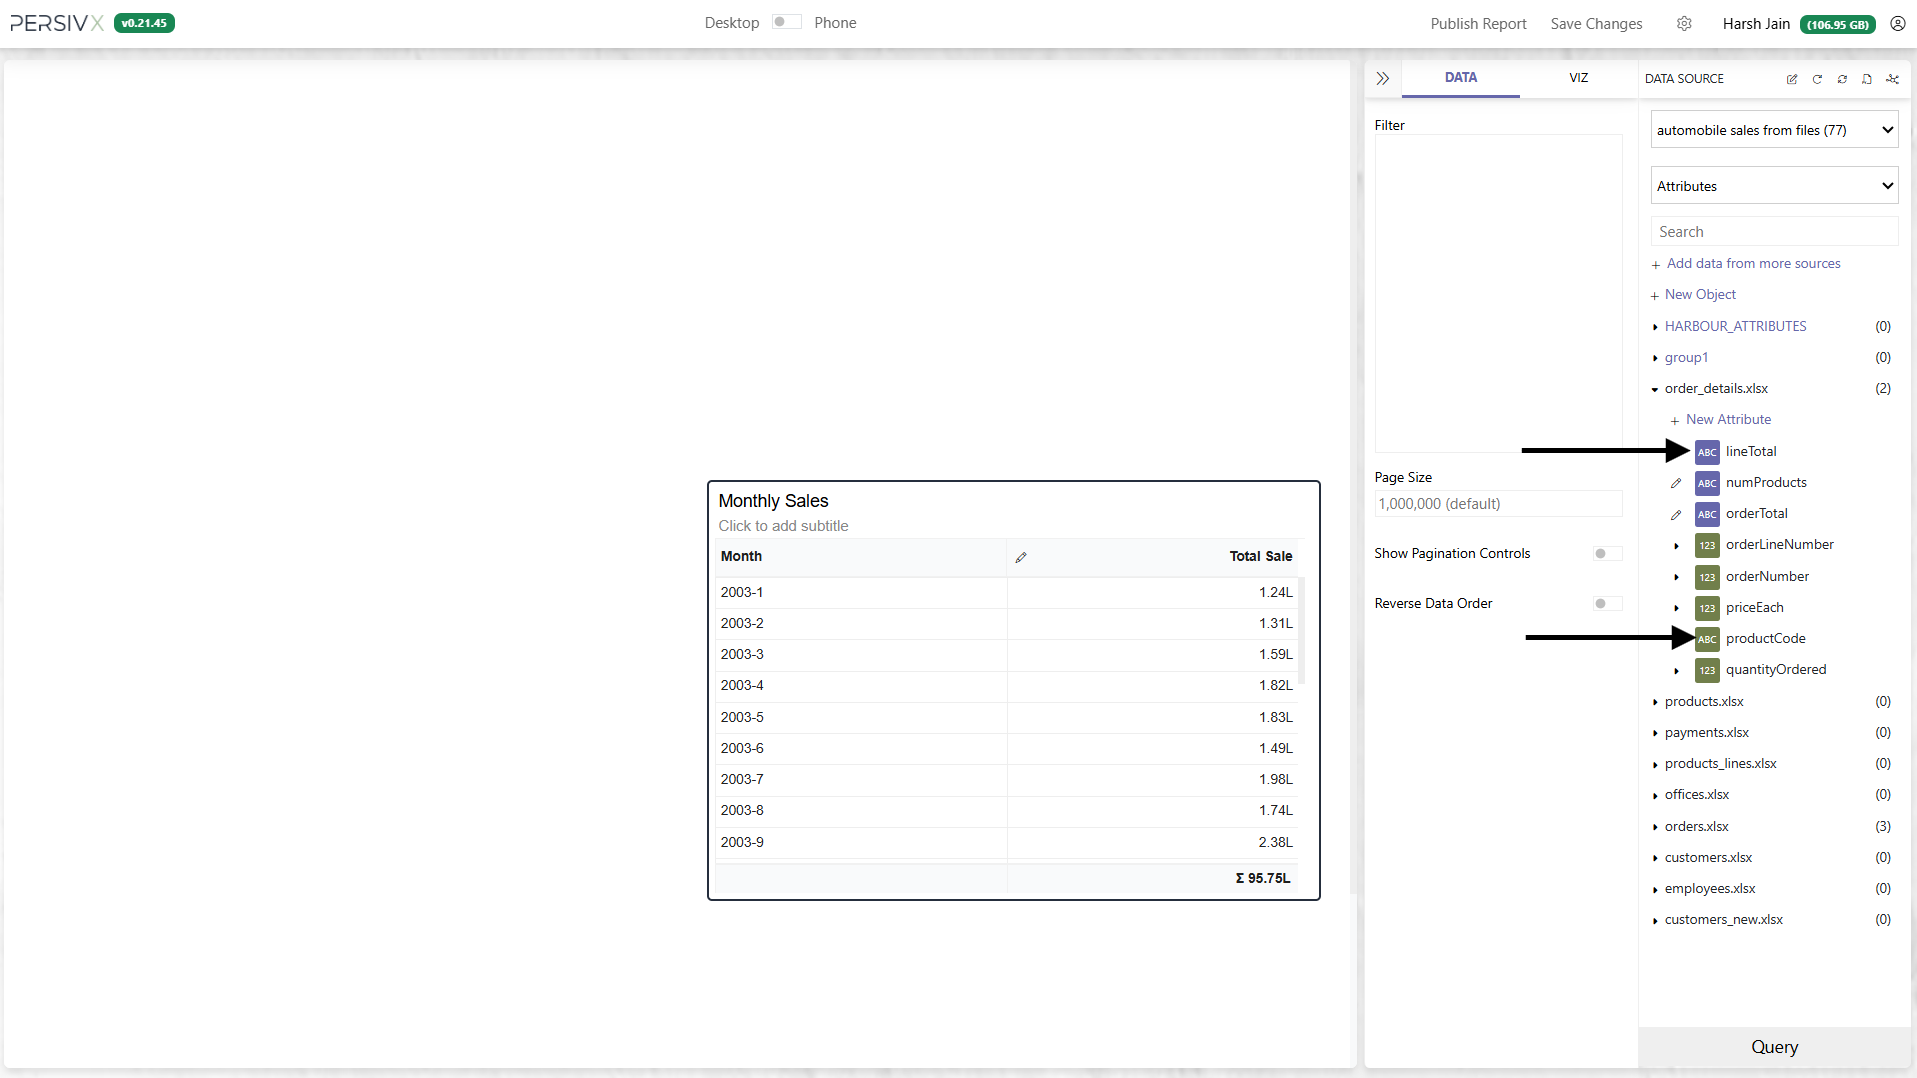
Because the formula lives at datasource level, it can be reused across tiles and reports, and any change to the calculation flows through to every visual using it. That is more manageable than repeating a Calculated Field in each tile.
Let's use the same example as the Calculated Fields page — displaying monthly sales.
Step 1: Identify the Fields You Need
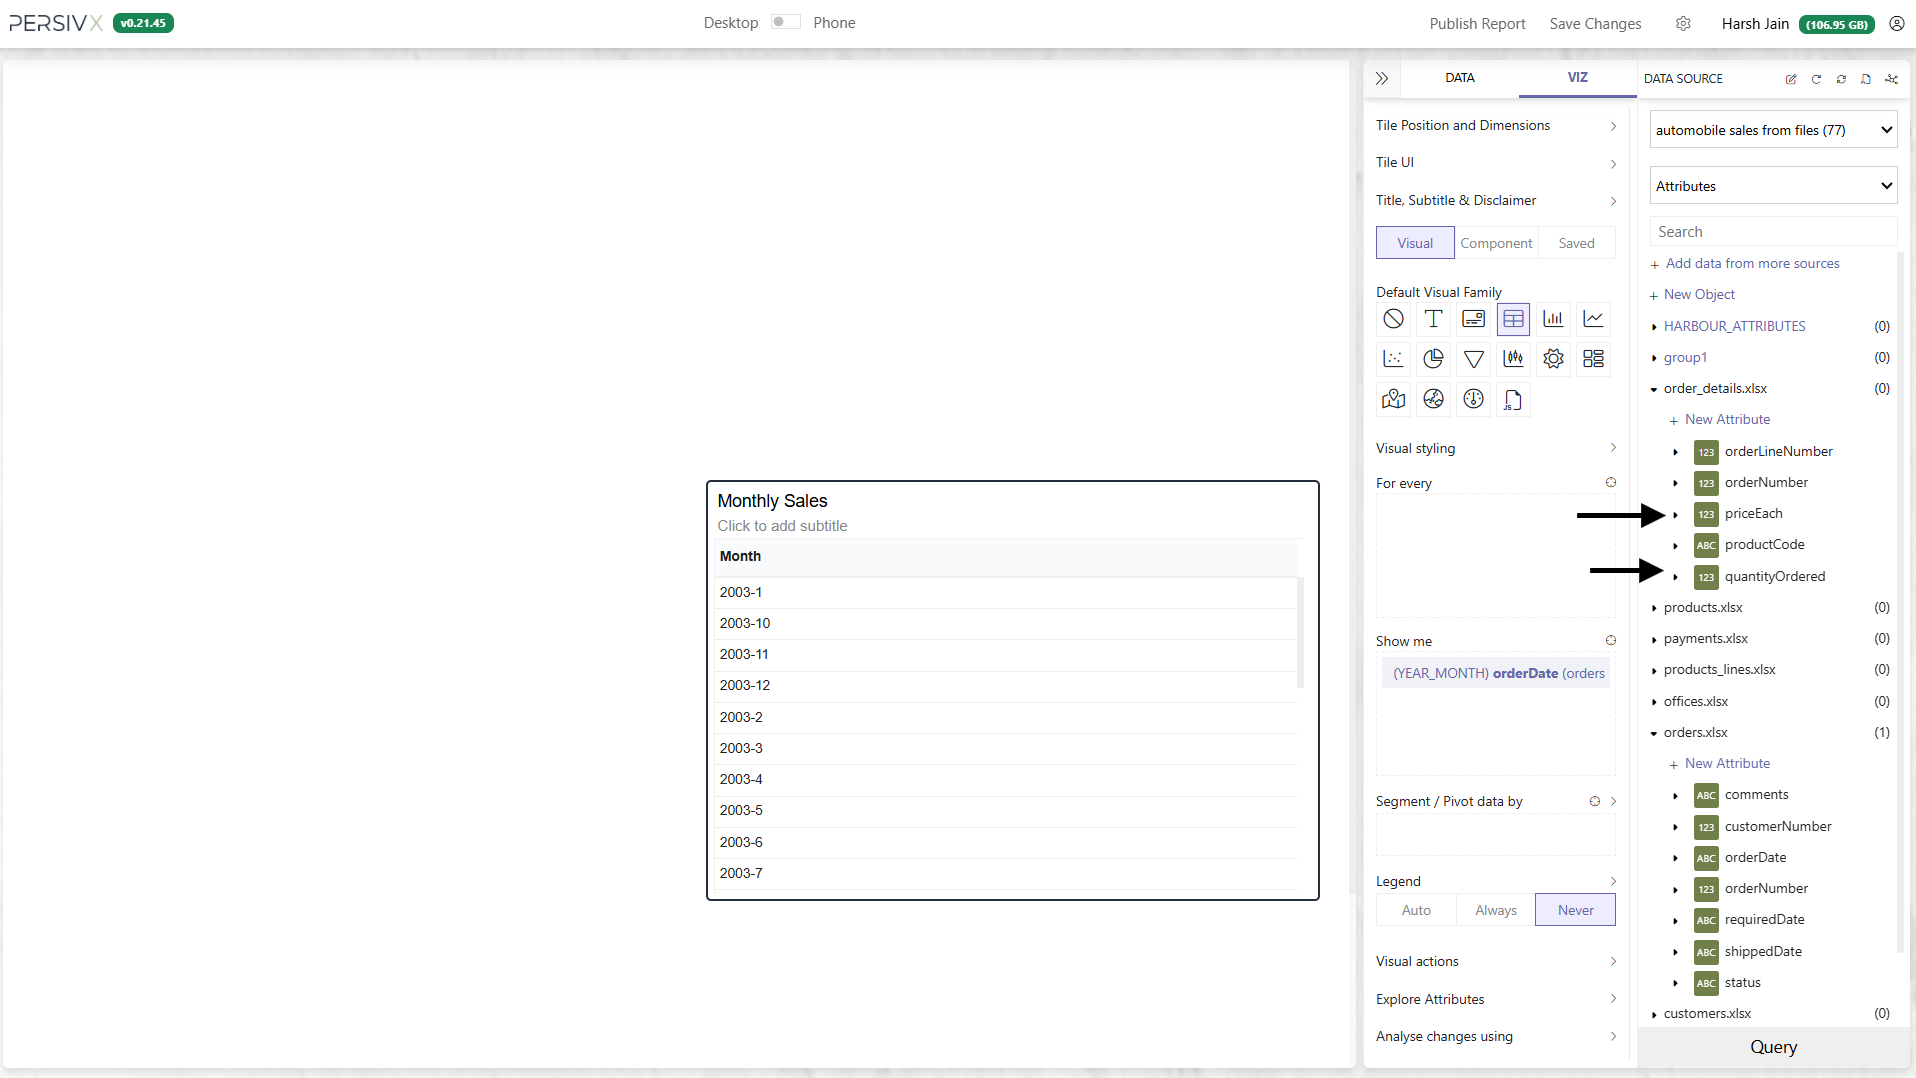
For every line item in an order we have the quantity ordered and the price of each unit. First calculate the line total: lineTotal = orderNumber * priceEach.
Step 2: Choose Where the Attribute Lives
Pick which table or object to add the new attribute to. This is purely organizational — it doesn't change behaviour, but keeping attributes in sensible places makes them much easier to find as their number grows.
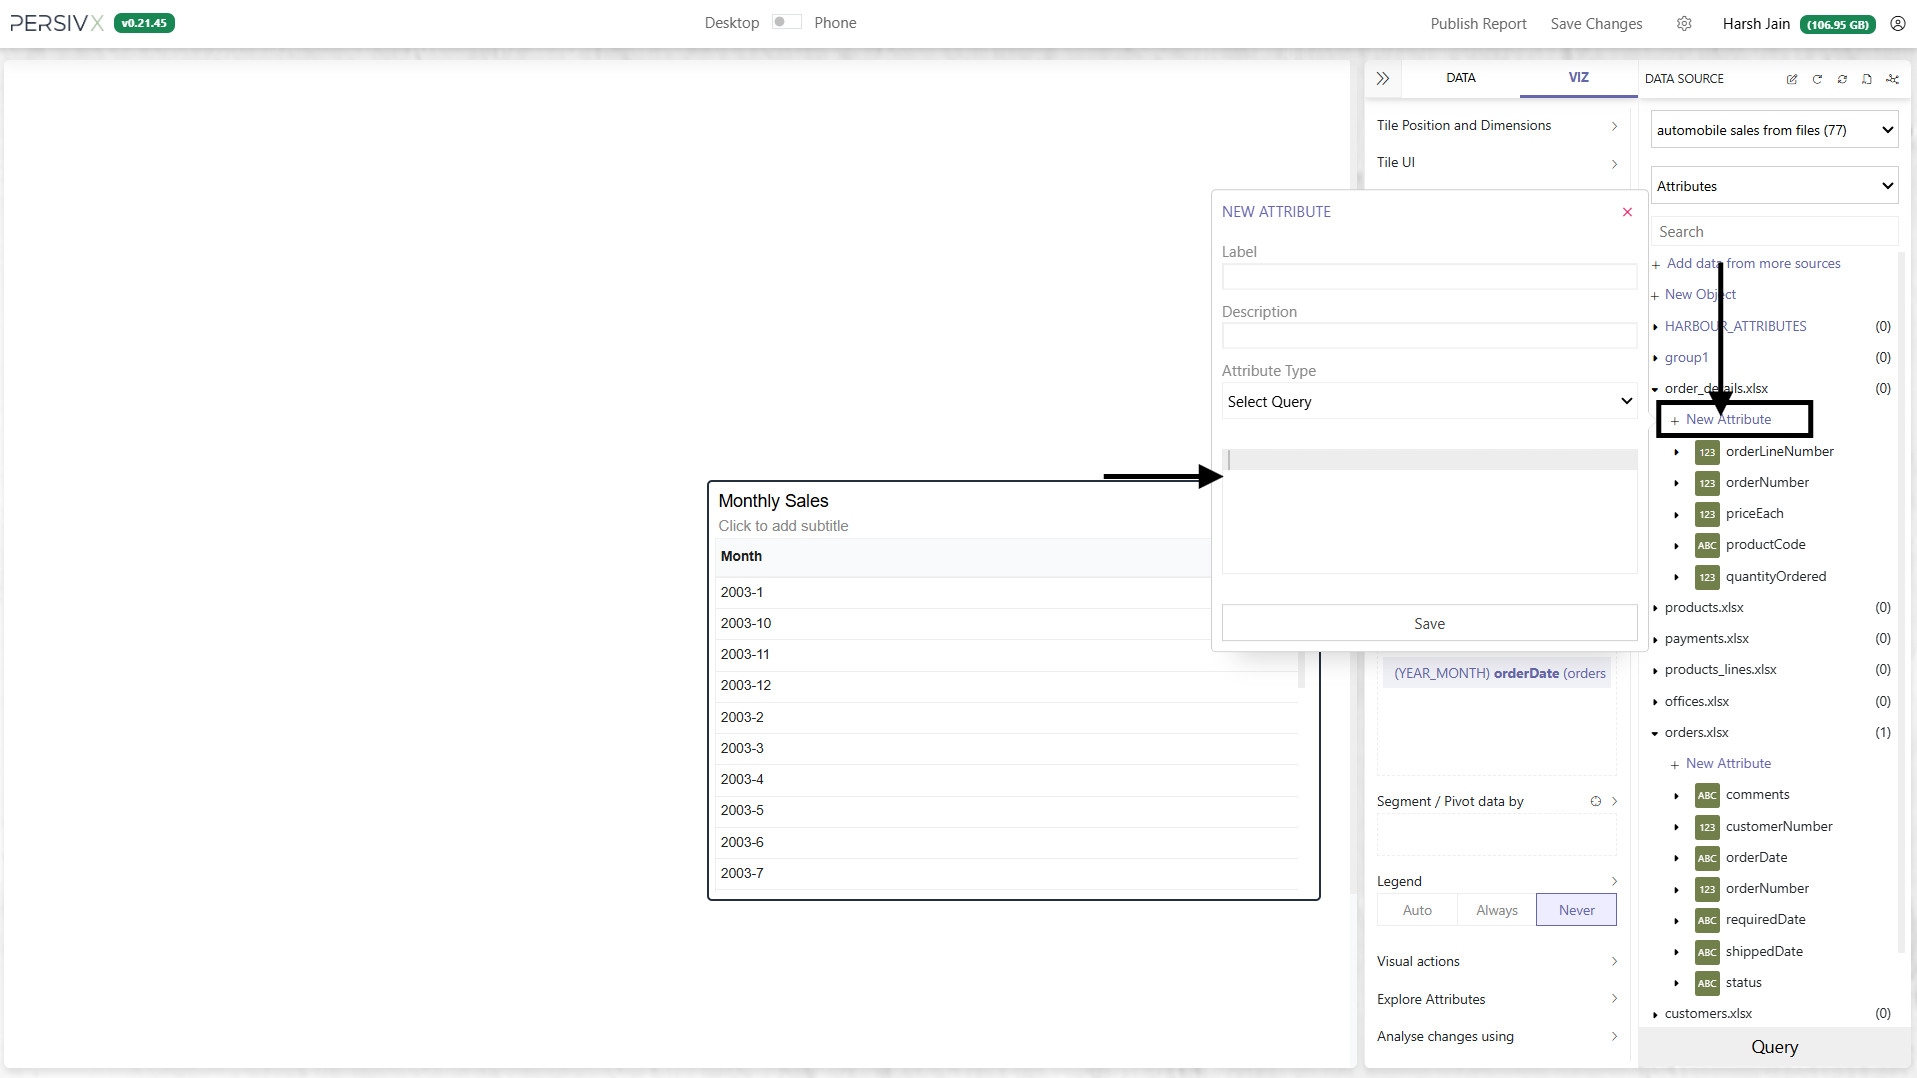
lineTotal belongs under the orderDetails table. Click + New Attribute under the table name and set the attribute type to SELECT QUERY.
Step 3: Write the Formula
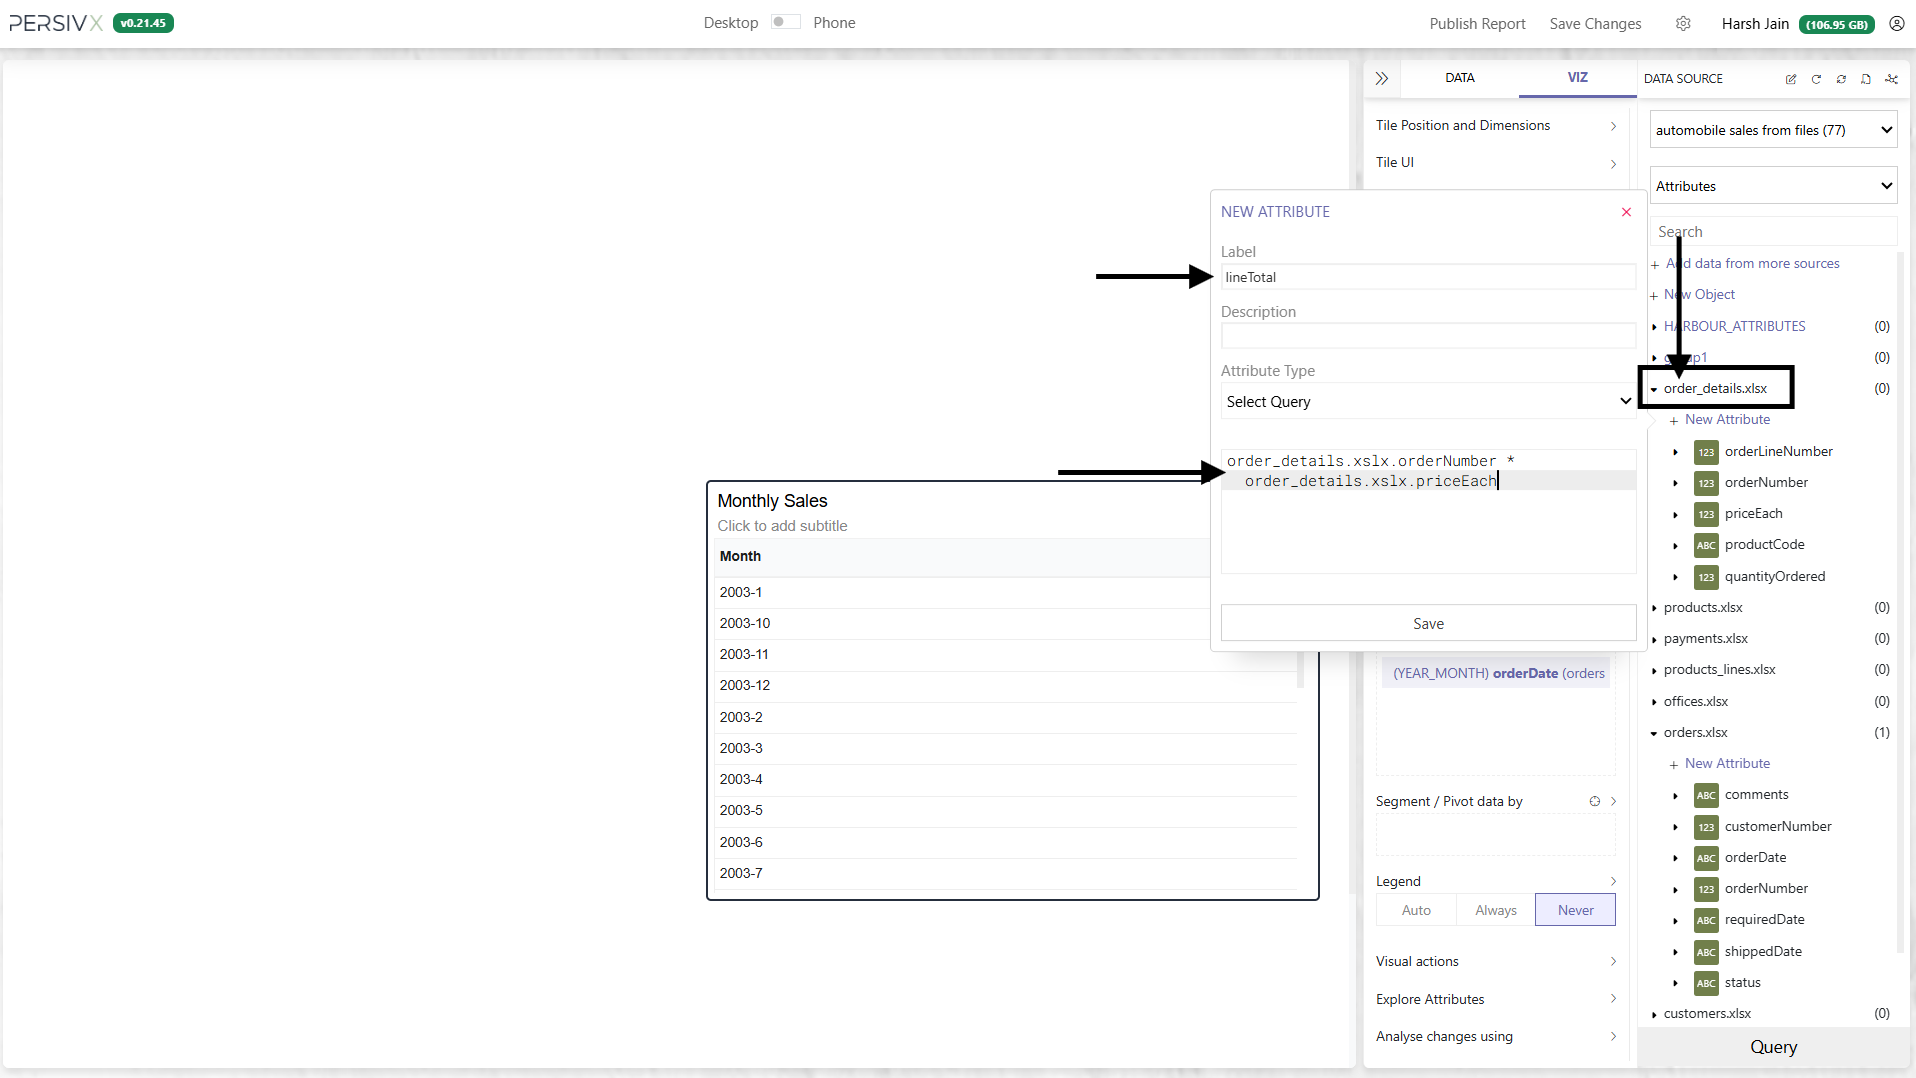
Add the formula and give the attribute a name. A description is optional, and the formula can be edited later.
<TABLE_NAME>.<COLUMN_NAME>. A formula may reference columns from different tables. And because the formula is used verbatim in the query, you can use any function or macro the datasource provides: date functions like EXTRACT(YEAR FROM …), aggregates like SUM, MAX, or GROUP_CONCAT, and conditionals like IF-ELSE or WHEN-THEN-END.
The formula we want is orderNumber * priceEach, which in the recommended format becomes:
order_details.xlsx.orderNumber * order_details.xlsx.priceEach
Here order_details.xlsx is the table name as shown in PersivX — the .xlsx appears because this example works from Excel files uploaded to PersivX.
Step 4: Use It
Click save and the attribute is immediately available to drag and drop. Add it to the visual.
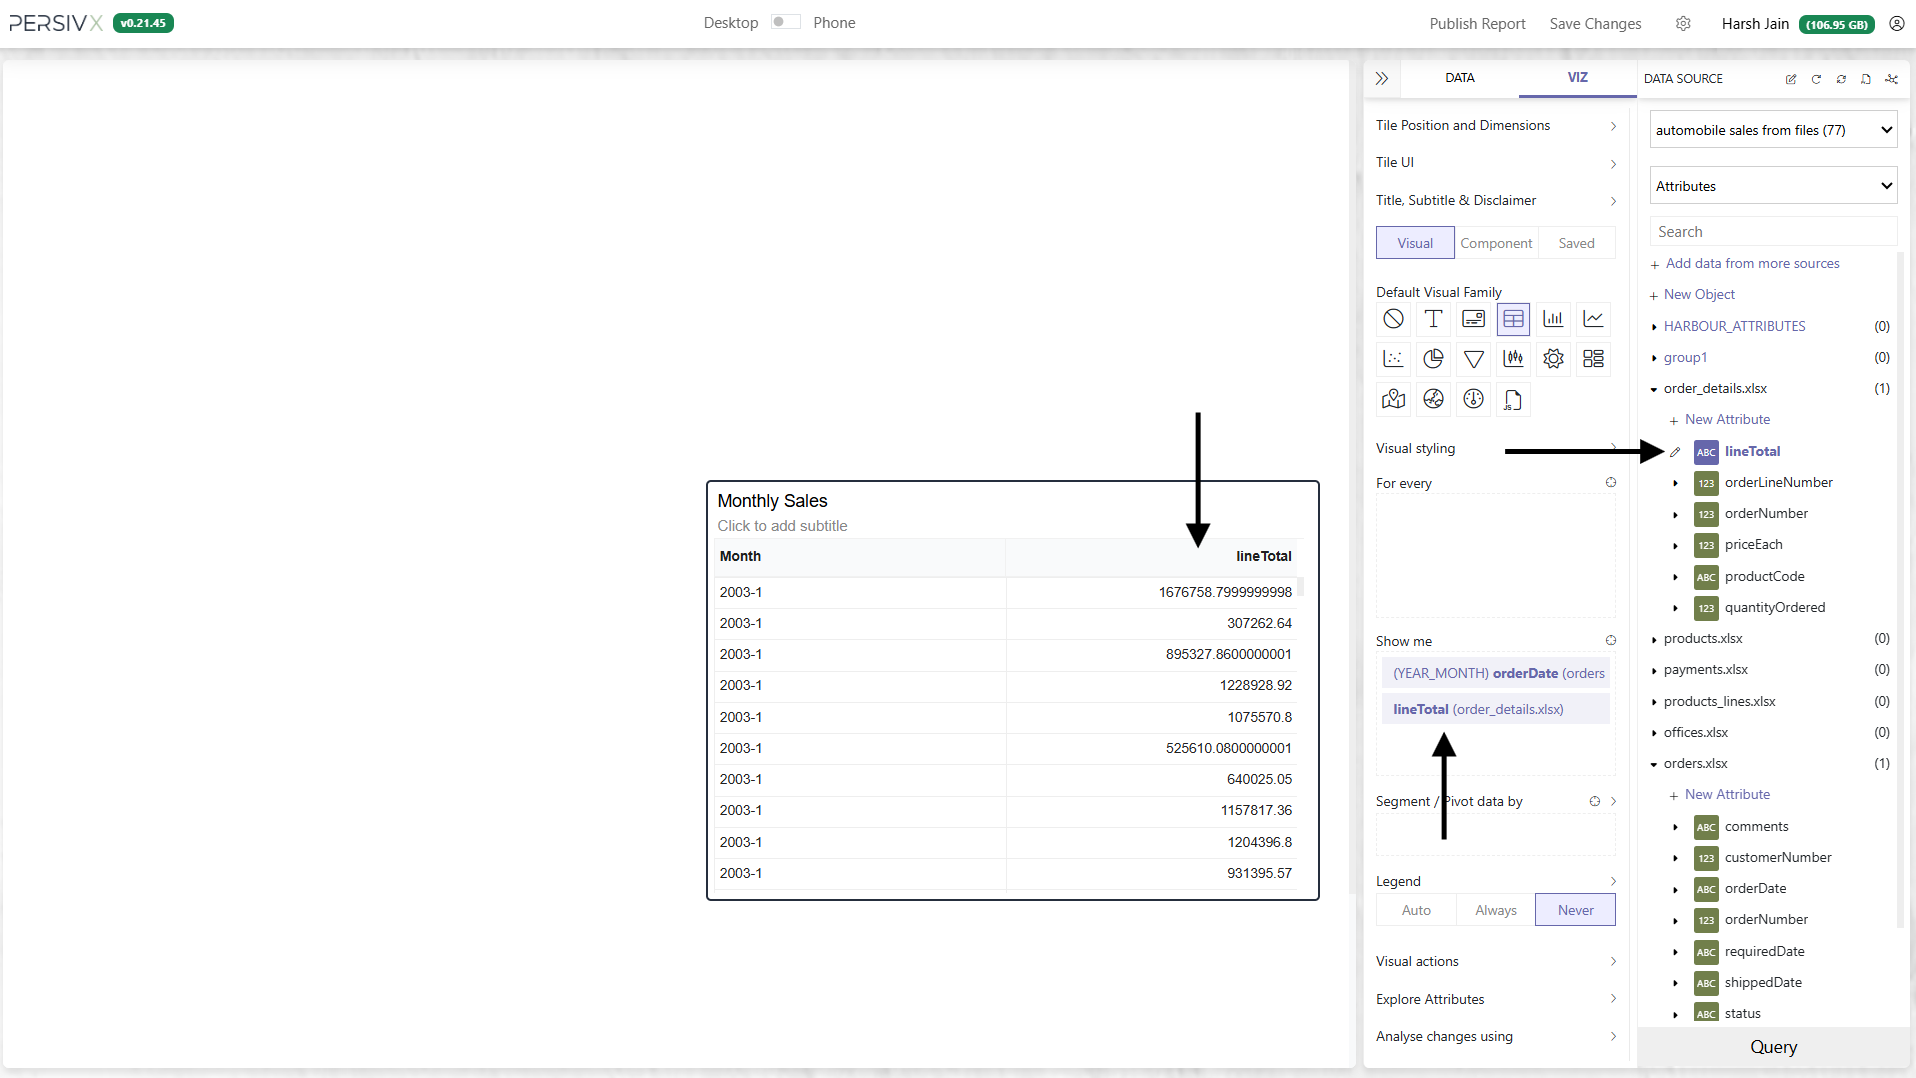
The values show up — but we want a SUM over lineTotal for each month to get monthly order totals.
You could edit lineTotal into orderTotal with the formula SUM(order_details.xlsx.orderNumber * order_details.xlsx.priceEach). It's better practice to create a second attribute, so both lineTotal and orderTotal remain available in future.
Step 5: Create the orderTotal Attribute
orderTotal belongs on the orders.xlsx table. Create a new attribute there and name it orderTotal.
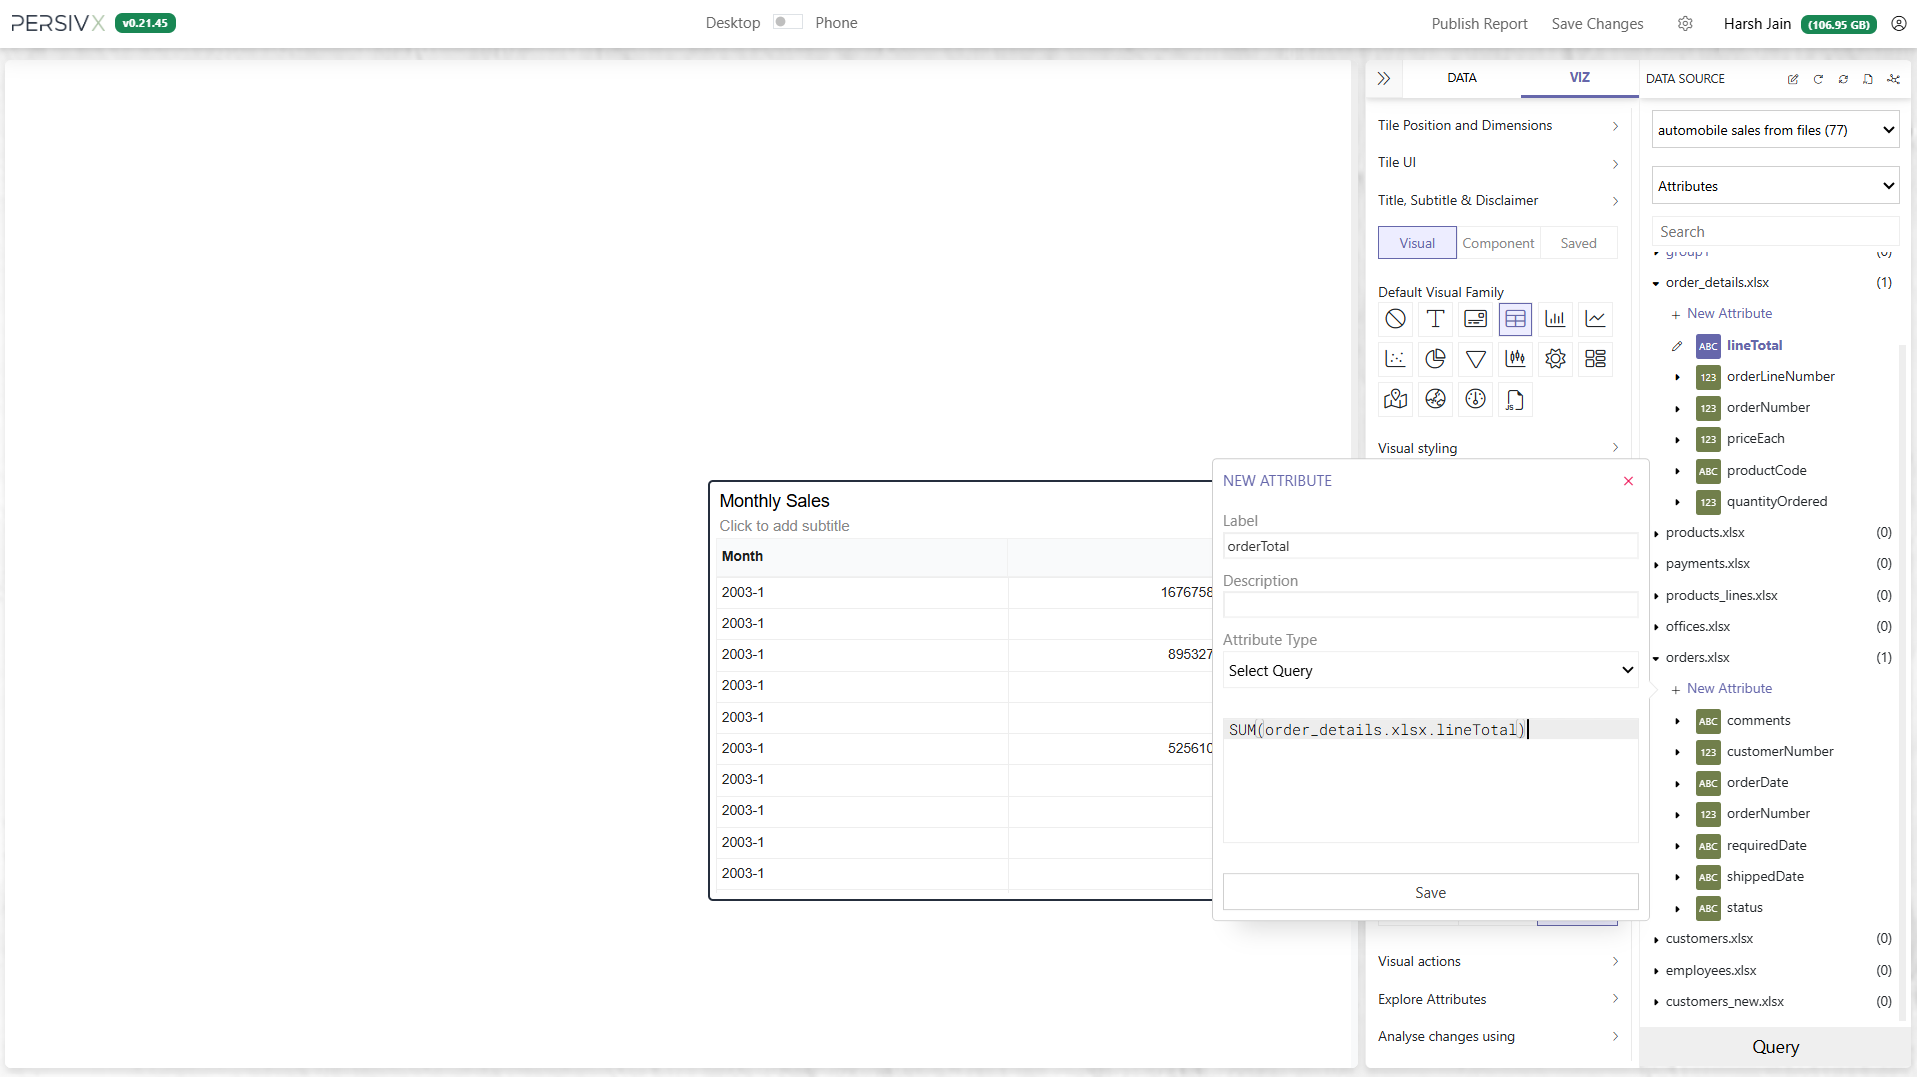
We could write out the full expression again, but lineTotal already computes it — so the formula simplifies to:
SUM(order_details.xlsx.lineTotal)
lineTotal is referenced as order_details.xlsx.lineTotal, where order_details.xlsx is the table the attribute was created on.
Step 6: Swap It Into the Visual
Save, then remove lineTotal from the visual and add orderTotal.
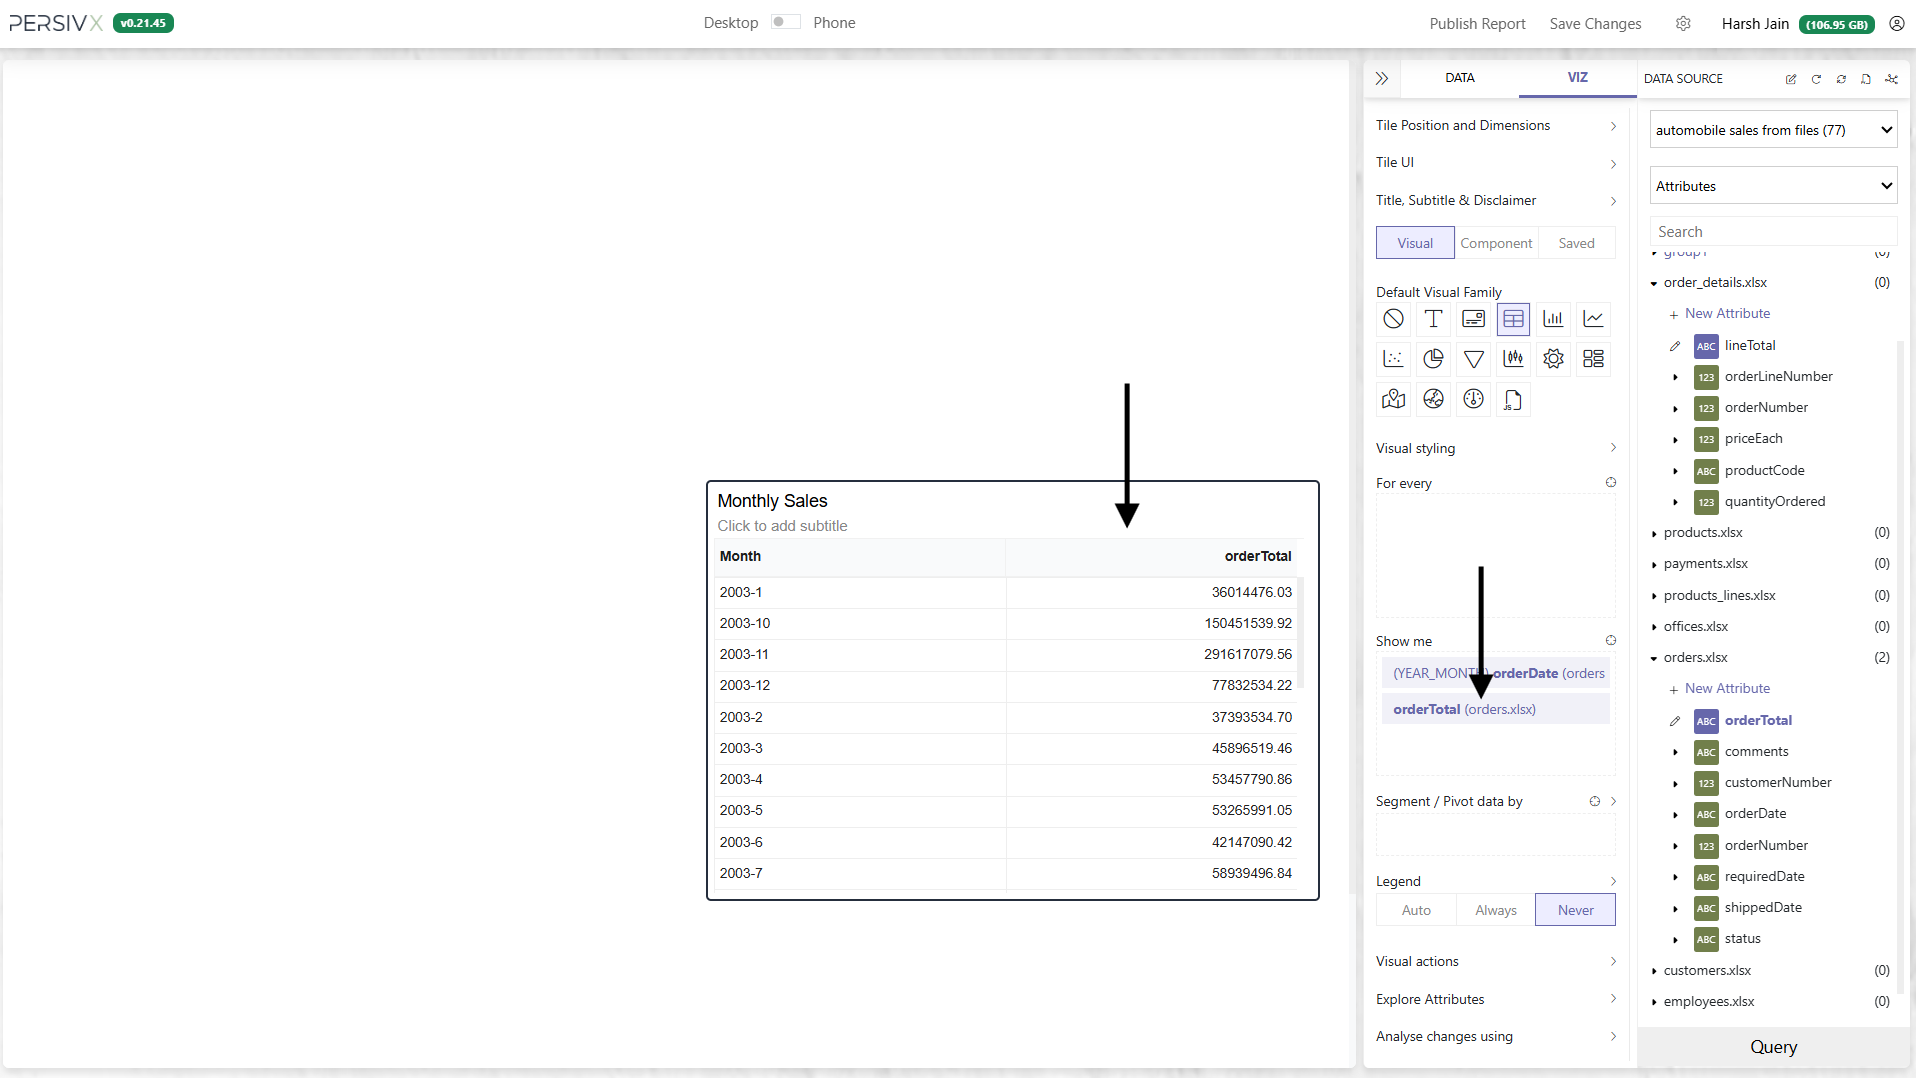
That gives the monthly sales figure. Drop more attributes onto the visual and PersivX updates the queries automatically. As always, you can change the visual type and customize the look and feel of each column.
lineTotal and orderTotal can now be added to any visual on this report, or on any other report using this datasource.