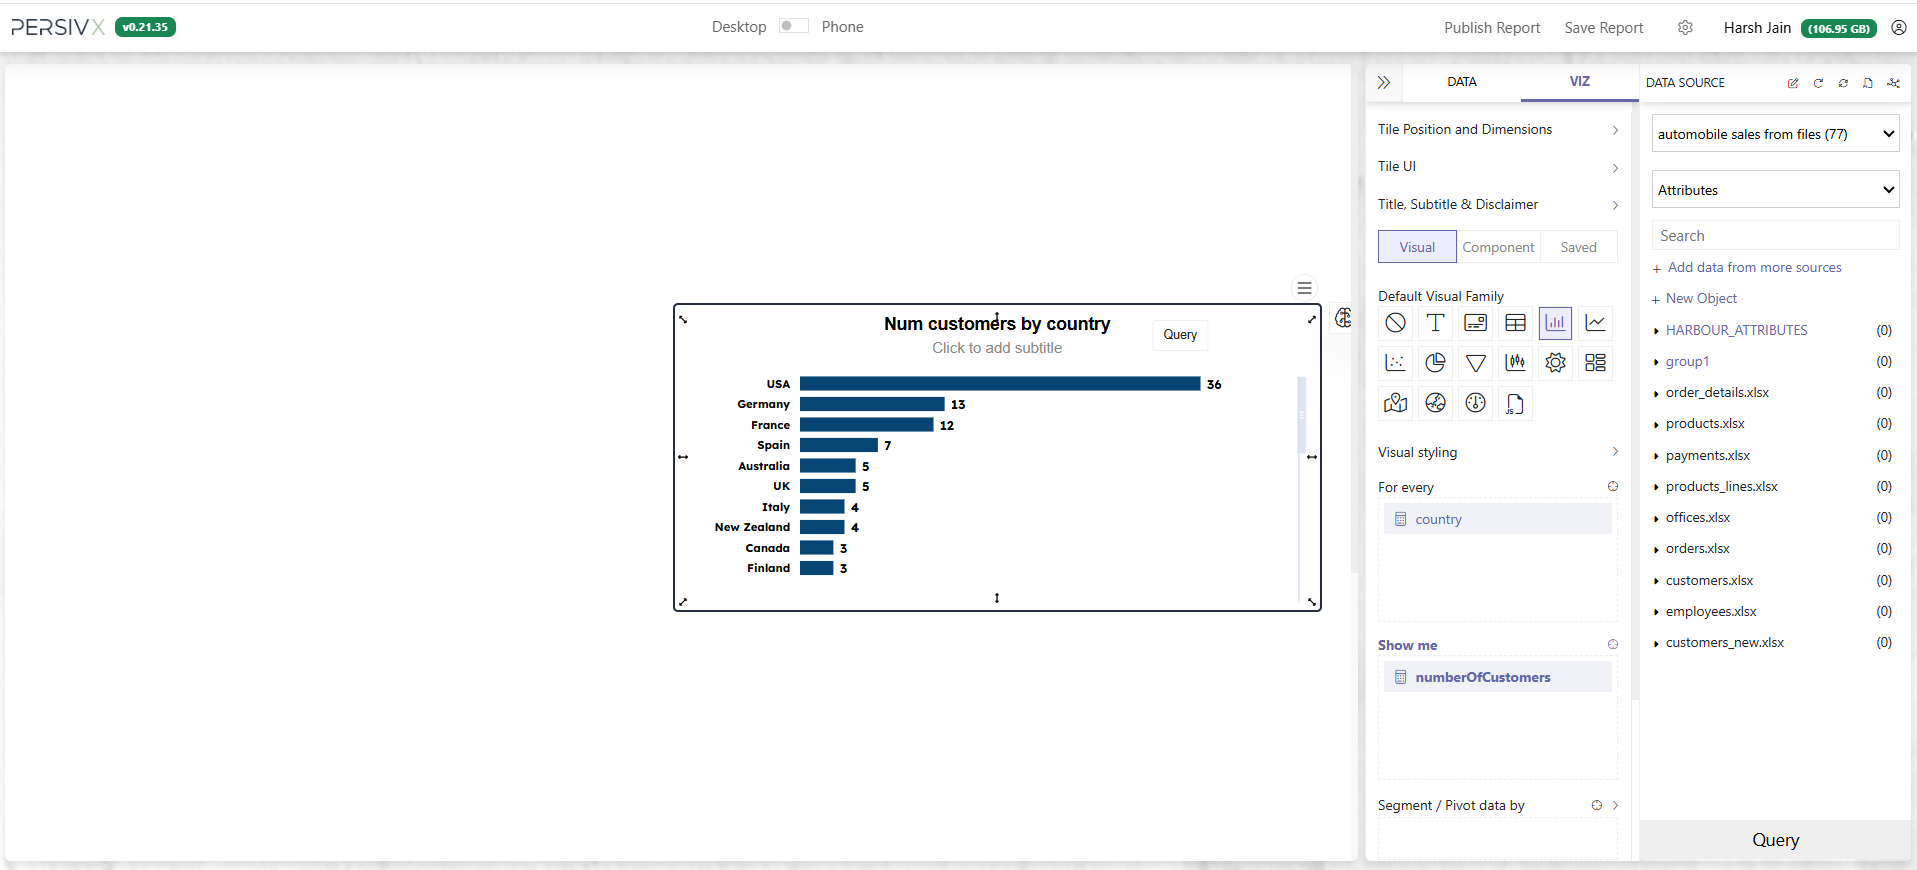
Creating Visuals with Custom Queries
Drive a tile from SQL you write yourself — without giving up any of the features drag-and-drop tiles get.
Visuals created with custom queries restrict nothing. You can still let readers filter with filter components, paginate data, drill down, run AI models, and everything else.
Step 1: Create a Tile
Click and drag in an empty area of the canvas to create a new tile.
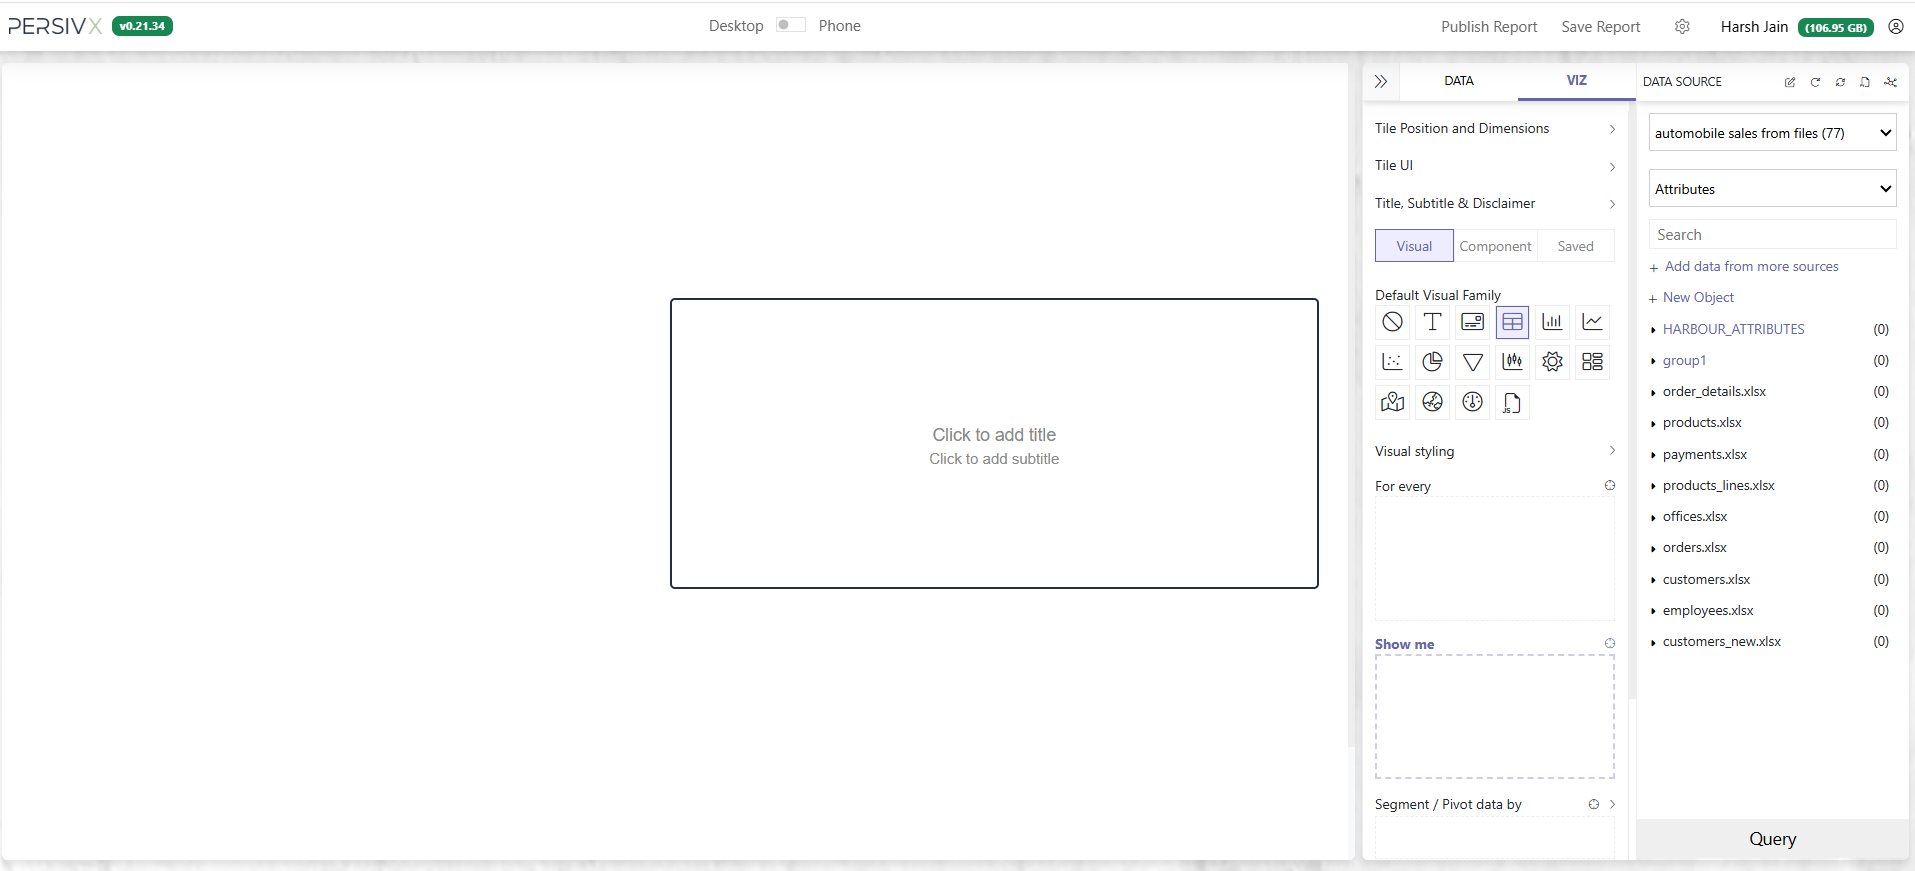
Step 2: Switch the Tile to Query Mode
Open the tile menu and, under Query & Transform, click Use Query to fetch data.
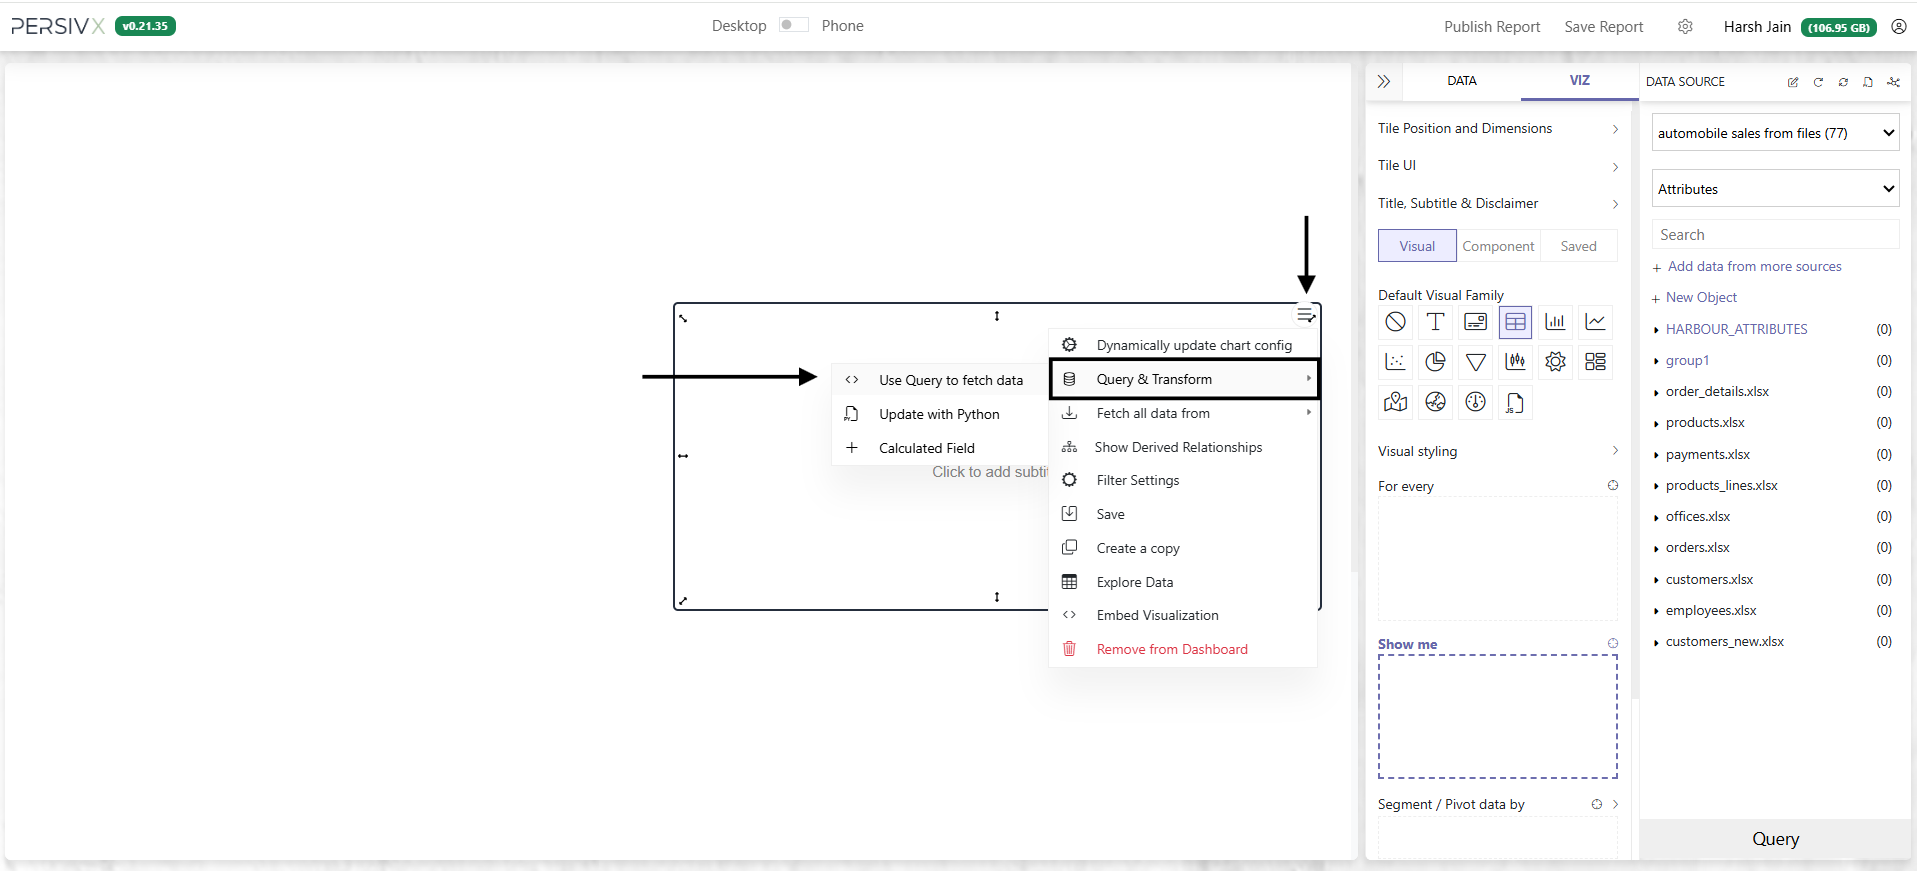
Step 3: Write the Query
The query editor opens. Write the query that fetches the data you want.
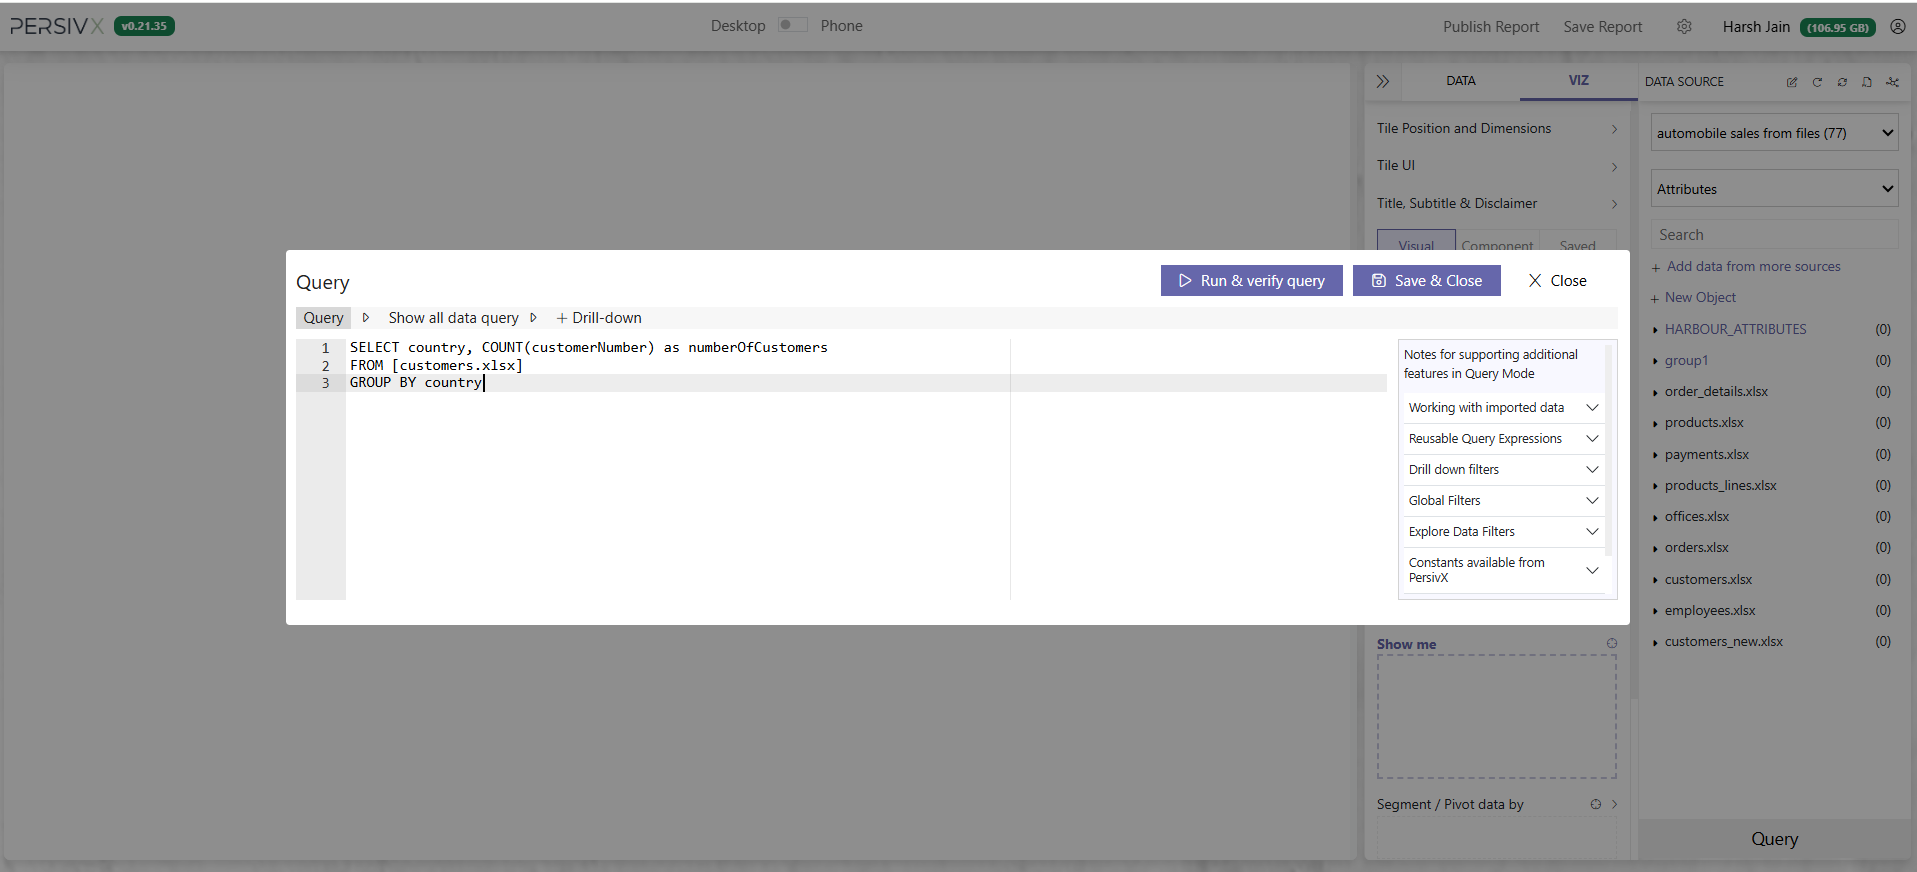
Step 4: Verify the Query
Click Run & verify query to confirm there are no errors.
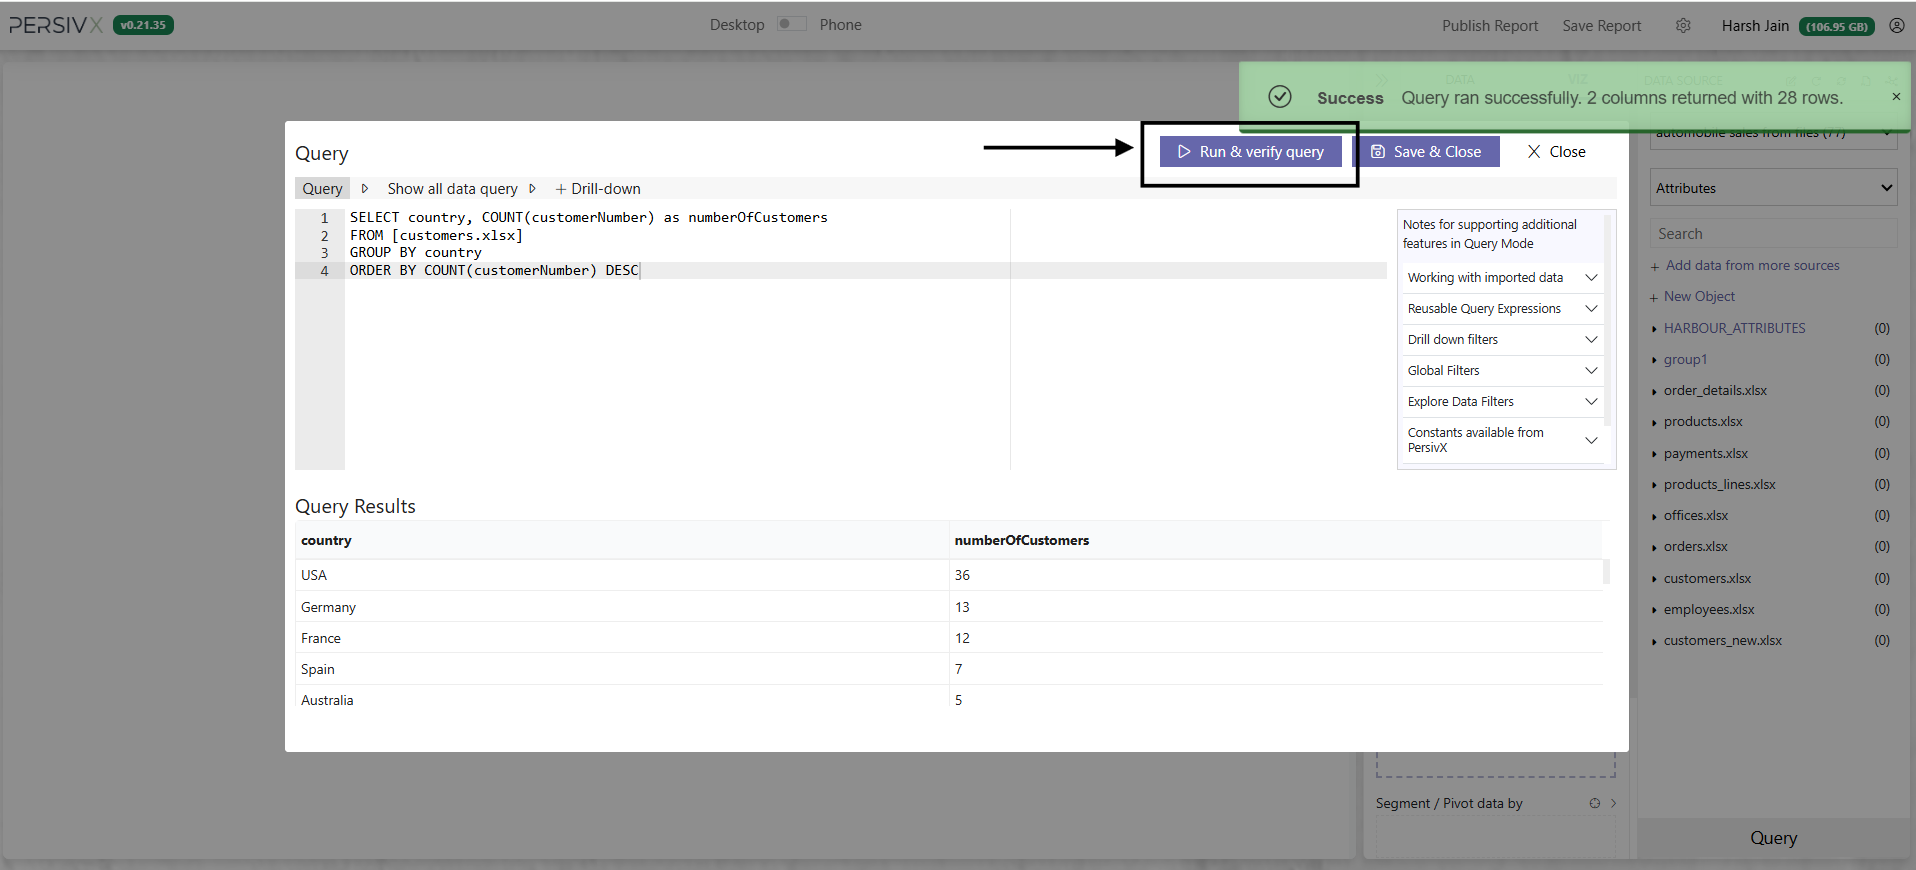
Step 5: Save
As soon as you click Save, PersivX builds the visual and shows the columns in the customization panel. From here you can customize the visual exactly as if it had been created with drag and drop.
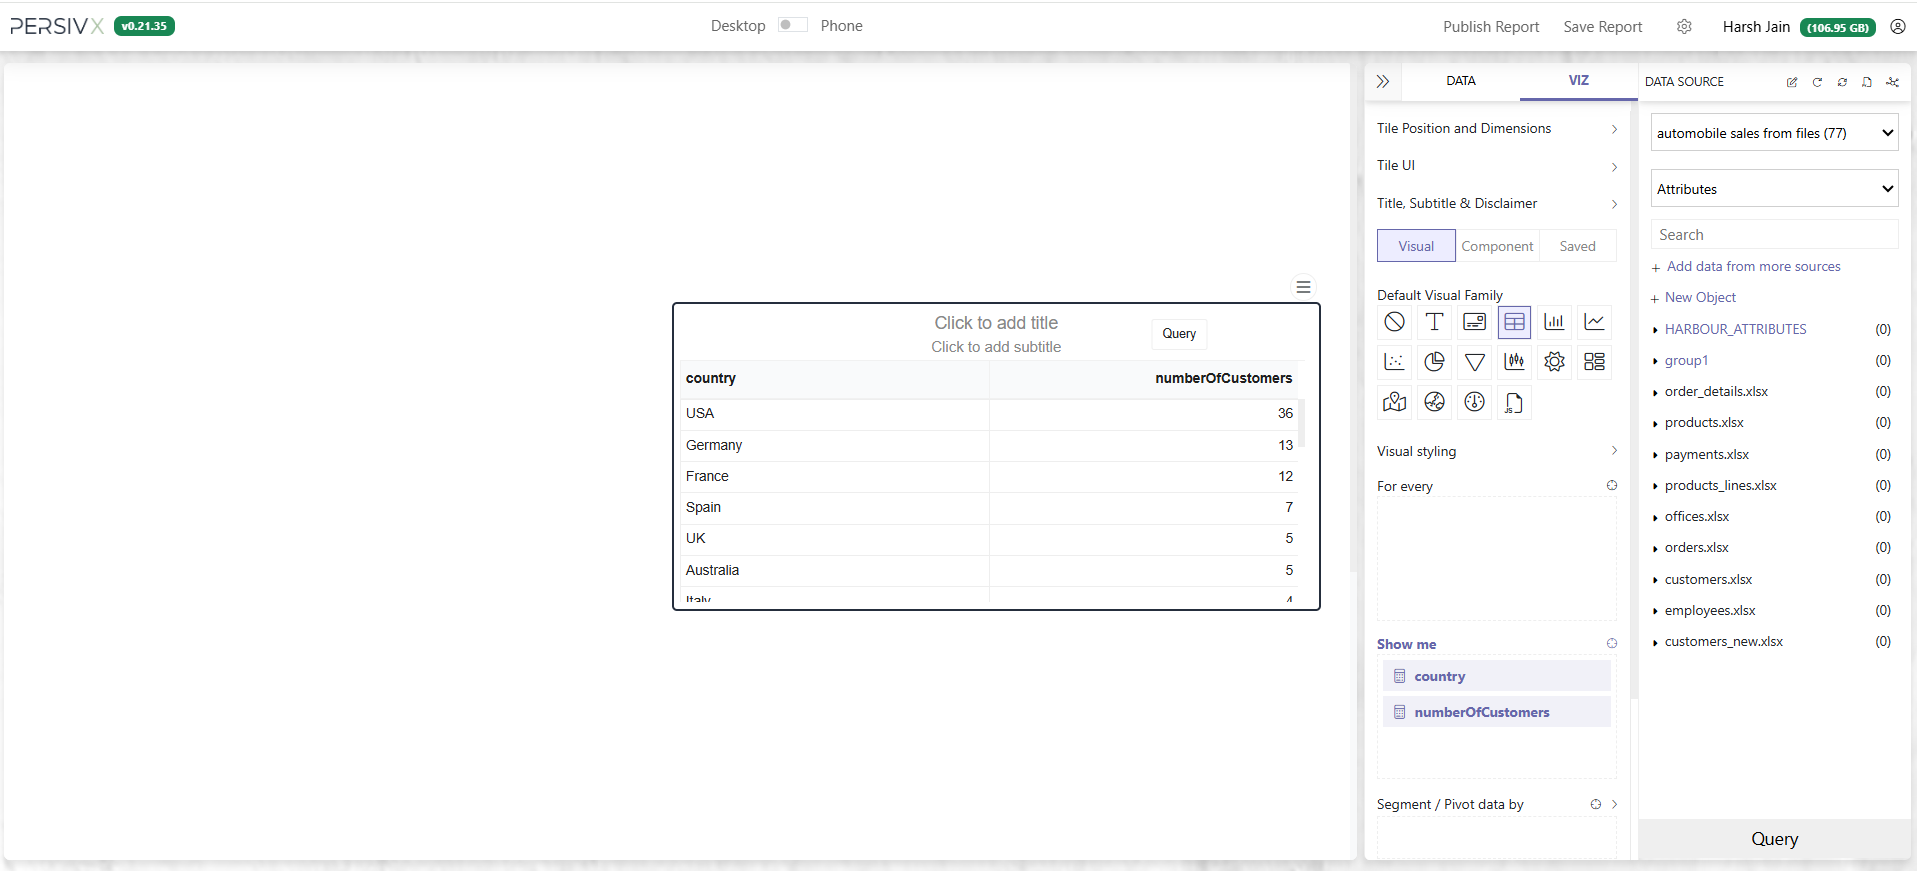
Step 6: Arrange and Customize
Arrange the attributes into the correct boxes, convert the visual to a bar chart, and style it. These steps are identical to those in Customizing Visuals.